The Ultimate Guide to Advanced Discounted Cash Flow Analysis (DCF) - How to Value a Company11/18/2020
Investing is tricky. Some investment strategies work really well, while most are no better than a flip of a coin. Learning fundamental analysis - discounted cash flow analysis in particular - is a timeless strategy with long-term success when done correctly.
If you are a medium/long-term investor, it is important that you cut through the noise and make common sense your investing strategy. Investing in good businesses without paying excessive premiums is at the center of common sense investing.
Would you invest $50,000 in this company?
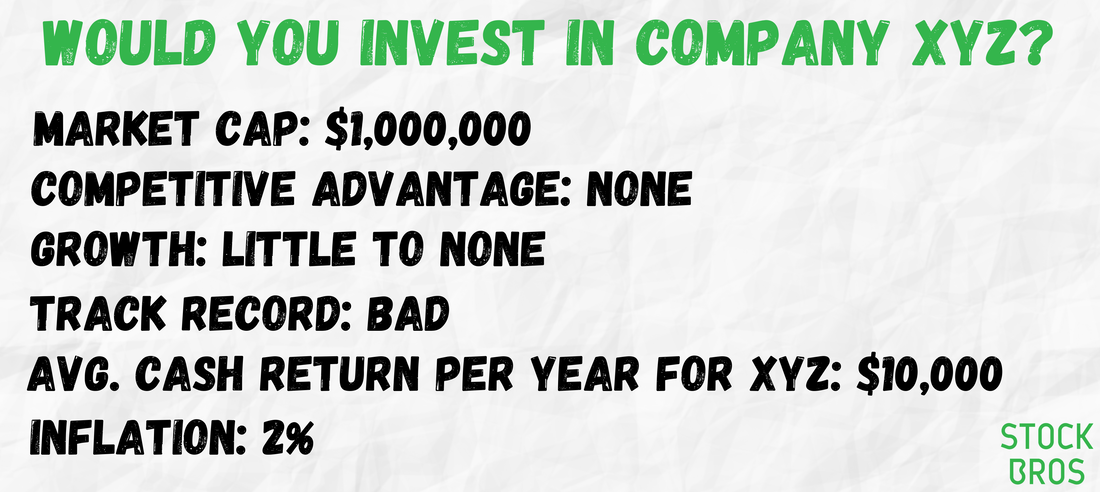
Let's use an example. Let's say the business owner of XYZ Company approaches you with an offer to purchase 5% of the business for $50,000 which equates to a valuation of $1,000,000. The business owner tells you that he or she will continue running the operation and you can let your money work for you.
You find out the business has been operating for 10 years without much progress. Growth in revenue is almost non existent and the company struggles to generate cash returns in excess of $10,000 a year. Most importantly, you don't believe the company has any competitive advantage or breakthrough technology that could help turn it around.
Your answer (we hope) is no. The reason is because you would never make your money back. As described in the example, the business has a bad track record with very little hope for the future. Even if you could identify the issues plaguing the company, there is very little you can do to influence the decisions of the company with your 5% stake if the majority holder doesn't want to listen.
In addition, with only $10,000 generated in cash every year available to shareholders, it would take 100 years to make your money back (if you or the company even survive that long). Assuming 2% annual inflation, your 1% annual cash return will actually yield a real return of negative 1%. Using your common sense, you just avoided the equivalent of setting your money on fire by choosing NOT to invest in XYZ Company. The same logic should be applied to the stock market. In the long run, good businesses will continue to grow in both profits and share price. Finding these businesses at a good price is the ticket to a comfortable retirement. However, how do we know when the price is good? Valuation can be a little tricky. Although the methods available are based on sound reasoning, the actual inputs into the models are the difficult part. This is because valuations are based on future assumptions which are obviously very difficult to forecast. To make matters worse, market dynamics are always changing meaning that valuations always need to be updated with new info. Nonetheless, being able to estimate the intrinsic value of a company does help you make informed decisions and improve your odds of success. This is especially true when combining it with other factors such as operational efficiencies and competitive advantages. This article on how to value stocks is based around the Discounted Cash Flow method of valuation. If you are unfamiliar with this method, please read the following introductory level articles: Contents of Article
1. a) Free Cash Flow to the Firm
1. b) NOPAT 1. c) Reinvestment Rate 1. d) Return on Invested Capital 1. e) Calculating Growth Rate 1. f) Stable Growth Phase 1. g) Putting it Together
3. a) Normalized Operating Income
3. b) Selecting a DCF model 3. c) Determining Growth Rates
4. a) Normalized Operating Income
4. b) DCF Model and Growth Rates
5. a) Research and Development
5. b) Calculating Growth Rates 5. c) Free Cash Flow to Equity 1. How to Value Profitable Companies That Reliably Grow Year-Over-Year1. a) Free Cash Flow to the Firm
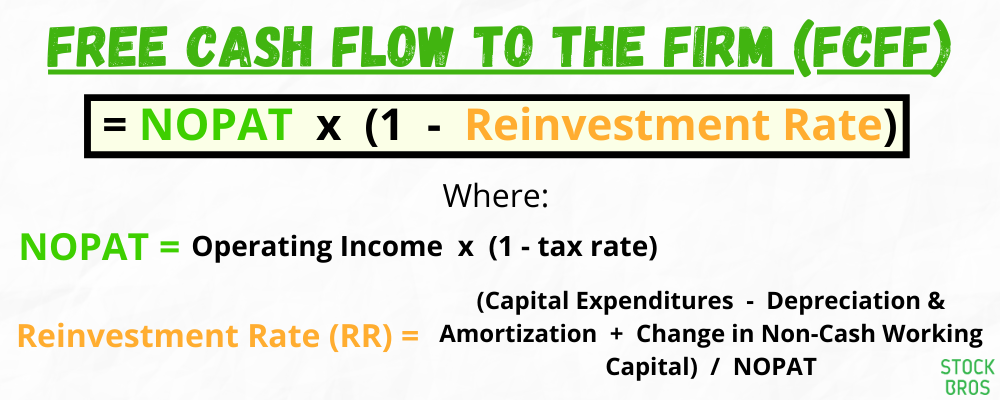
For this article, we will be using unlevered free cash flow (aka free cash flow to the firm). The reason for this is because FCFF is easier to model than levered free cash flow (aka free cash flow to equity). The way we will calculate FCFF for valuation purposes will be as follows:
1. b) NOPAT
The first thing you will need to do is determine the Net Operating Profit After Tax (NOPAT). The formula is as follows:
NOPAT = Operating Income x (1 - tax rate) The tax rate that should be used is the marginal tax rate of the country in which the company being analyzed operates in. If a company operates in multiple countries, you have the option of using an average marginal tax rate that is weighted by the portion of operating income that came from each country. However, this information is seldom available. The reason we like starting from NOPAT versus cash flows from operations is because we like to treat stock-based compensation as a cash expense. Stock-based compensation dilutes shareholders thus reducing the per-share value. Given that this is a common practice that takes place every year, treating it as a cash expense will provide a more conservative valuation that will indirectly factor in future dilution. Since the operating income section already includes this expense, it allows us to skip a step in our calculations. 1. c) Reinvestment Rate
The reinvestment rate determines what percentage of the company's operating income is reinvested into the business in order to grow it. Reinvestment rate is calculated as:
RR = (Capital Expenditure - Depreciation & Amortization + Change in Non-Cash Working Capital) / NOPAT In this formula, capital expenditures (CapEx) represents the long term investments in properties, plants and equipment that help grow the company and increase production. Depreciation and amortization is used as an estimate for maintenance CapEx. Thus, in order for a company to see growth in terms of production, the investment in CapEx needs to be greater than the amounted needed to simply maintain existing operations. Change in non-cash working capital is the amount that is invested for the short term. This includes things like inventory and short-term debt that are needed for day-to-day operations. However, this formula is incomplete for companies that routinely make acquisitions. For some industries, it makes more sense to buy smaller companies rather that trying to grow organically. This is especially in fragmented industries such as waste management or convenience stores. Therefore, we must add the acquisition costs to the formula for these companies: RR = (Acquisitions + Capital Expenditure - Depreciation & Amortization + Change in Non-Cash Working Capital) / NOPAT 1. d) Return on Invested Capital
The return on invested capital (ROIC) is used as a way to measure how efficiently management is running the company. The higher the ROIC, the better management is performing. This metric is best used to compare companies within the same industry because different industries have different capital requirements. The formula for ROIC is:
ROIC = NOPAT / Invested Capital Invested Capital = Current Assets - Current Liabilities - Cash + Non-Current Assets 1. e) Calculating Growth Rate
When determining what growth rate to use, you have 2 options. The first option is to calculate the compound annual growth rate (CAGR) of NOPAT. With this method you are assuming that growth will continue at this rate which it might very well do so. However, method ignores any fundamental changes that may have occurred to the company in more recent times.
A better alternative would be to calculate a fundamental growth rate. As the name implies, the growth rate is determined by analyzing the fundamentals to determine a growth rate that can actually be sustained for an extended period of time. For NOPAT, the growth is calculated as follows: Fundamental Growth Rate = Reinvestment Rate x Return on Invested Capital As an aside, the formula can also be tweaked to calculate sustainable earnings growth. All you would need to do is replace ROIC with return on equity and switch out reinvestment rate with the retention ratio. 1. f) Stable Growth Phase
In a 2-stage DCF, the fundamental growth rate is used for the first stage. However, in the second stage, which is known as the stable growth phase, we assume growth slows down to a perpetual growth rate. This means we are assuming that a company will grow at this new rate forever. To determine the perpetual growth rate, you have three options.
The first option is to set it at the rate of long term inflation which is roughly 2 percent. Option number two is set it as the current risk free rate. The most popular choice for risk free rate is the 10 year US treasury yield. However, you may choose whichever US treasury yield makes most sense to you. The final option is to use a rate that is company specific. For example, some REITs negotiate contracts that include annual rent increases of over 3% to existing customers. In addition, to stay consistent with the formulas above, we need to decrease our reinvestment rate as well to match the growth rate. Thus, to calculate the reinvestment rate during this phase, we will do the following: Stable Reinvestment Rate = Perpetual Growth Rate / Weighted Average Cost of Capital The WACC in this scenario acts as the ROIC during this stable growth phase. If you believe that the company you are analyzing has a permanent competitive advantage and will likely continue delivering returns above its WACC, then you can set the denominator to a number within 4 percentage points above the WACC. Anything above 4% is likely too aggressive for a company to maintain "forever". 1. g) Putting it Together
Now that you have all the information, it's time to forecast future cash flows and determine what the company is worth using a 2-stage DCF.
Example: Operating income = $100 USA marginal tax rate = 27% Reinvestment rate = 50% ROIC = 20% Growth Rate = 10% Discount Rate (WACC) = 5% Perpetual Growth Rate = 2% Stable Reinvestment Rate = 40% Total Debt = $500 Market Cap = $1,000 Shares Outstanding = 100 Cash = $100
As we can see from this example, the company is currently undervalued because the market cap is less than the equity value calculated by our DCF. As long as there isn't excessive share dilution, the same will hold true on a per-share basis.
When determining growth rates for the first phase, we recommend looking at the annual reinvestment rates and ROIC numbers from the past 5 years in order to see if a company has been historically consistent. 2. How to Value High Growth Companies
When valuing companies that are growing fast, the same rules apply as the previous section. You will need to use the same formulas as well as a DCF. The difference however, is in the DCF itself. Instead of a 2-stage model, a 3-stage model would be more appropriate.
The 3-stage model has a transition phase that goes in between the growth and stable phases. The best way to setup the transition phase is to linearly decrease both the growth rates and reinvestment rates from the growth phase to the stable phase. This can be done over a 5-year period meaning that the stable phase will be pushed out into year 11. This is illustrated in the example below:
This method appears to be more realistic than a 2-stage model because it's unlikely that a company growing at 30% or more will suddenly slow down all the way to 2% the following year.
3. How to Value Cyclical Companies3. a) Normalized Operating Margins
Cyclical companies are businesses that are very sensitive to market cycles. They tend to see staggering growth during economic booms and sharp declines during recessions. As a result, choosing an appropriate figure as the operating income to base your calculations on is crucial. Using the operating income produced at the top of an economic boom will result in overly optimistic assumptions. Likewise, basing your calculations on the operating income generated during a deep recession will unfairly undervalue a business.
The best way to tackle this issue is by using a normalized operating margin. Simply take the average of a company's operating margin over the past 10 years (roughly the length of a business cycle) and apply it to the current year's revenue. You will then subtract the marginal tax rate to arrive at NOPAT, which will act as the starting point for your valuation. NOPAT for Cyclicals = Revenue x Normalized Margin x (1 - Marginal Tax Rate) 3. b) Selecting a DCF model
Deciding whether to use a 1 to 3-stage DCF can be a little tricky for cyclicals. If the economy was just coming out of a recent recession, you would not want to use a single-stage model because the company is likely to see strong growth during the recovery stage leading to a new boom. Furthermore, using a multi-stage model when the most recent recession was over 10 years ago might be too aggressive. Thus, you will need to use your best judgement on which model makes most sense to you depending on the current market conditions.
An alternative option is to use all three models. You may choose to take the average of all three outputs or break them down into a bull case, a bear case and a base case. Whichever way you go about it, the most important thing is that you understand the characteristics of cyclical companies in order to prevent extremely optimistic/pessimistic valuations. 3. c) Determining Growth Rates
If you do choose to use a multi-stage model, determining growth rates will require the same formulas as already discussed above. However, you will need to find the average reinvestment rate of the past 10 years along with the average ROIC. This will allow you to stay consistent in your calculations.
4. How to Value Commodity Companies4. a) Normalized Operating Income
Similar to the cyclicals, you need to normalize operating income when dealing with commodity based companies. The reason is because the underlying commodity prices are subject to wild and unpredictable price swings that can last for an extended period of time. Thus, the way to normalize operating income from these companies differs greatly from the cyclicals.
Instead of using average margins, OI will be normalized using regression analysis by setting commodity prices and company production as the independent variables and operating income as the dependent variable. For commodity prices, you want to use the average of the time periods being used. For example, if using quarterly data for operating income and production, you will want to get the quarterly average price of the commodity. The advantage of this method is that you can include as many variables as you want and can get an actual measure of the statistical validity of each. As an example, for a mining company that mines multiple metals, you can include the production and average price of each metal to see how it affects earnings. Once normalized OI has been determined, you will use the marginal tax rate to calculate NOPAT as follows: NOPAT = Operating Income x (1 - Marginal Tax Rate) 4. b) DCF Model and Growth Rates
Now that you have NOPAT, it is time to find the reinvestment rate to arrive at the free cash flow to the firm. An interesting approach you can possibly take would be to perform a regression where you swap out operating income with reinvestment rate as the dependent variable. If the results are statistically significant, then you may use that as the reinvestment rate. However, this would be very time consuming. Thus, it would much easier to simply use the current reinvestment rate as it reflects the company's activity given the current commodity prices. Alternatively, you may also use the stable reinvestment rate calculated as perpetual growth rate divided by weighted average cost of capital.
For the valuation, it is best to use a single-stage model (the same as the stable phase of a multi-stage model) because commodity prices are volatile. In addition, since the nature of the business is highly sensitive to the price changes, it becomes very difficult to make any accurate forecasts. Therefore, it's best to view valuation through the lens of what the company is worth today under current market conditions. Still, you may take it a step further and perform scenario analyses to see how the valuation changes as commodity prices and output levels change. This way you have something to quickly refer to as conditions are altered. 5. How to Value Tech Companies5. a) Research and Development
Unlike other industries, technology companies rely heavily on research and development investments rather than capital expenditures. However, the valuation methods mentioned above in this article do not factor R&D into growth rate calculations. The reason is because unlike CapEx, R&D is not capitalized onto the balance sheet in order to be depreciated over time. This is due to accounting practices that have not been updated to reflect the increasing shift towards a larger portion of intangible assets.
Thus, companies that require very few physical assets may result in having negative invested capital when calculated using the traditional method mentioned earlier. Obviously, this creates a problem because the fundamental growth rate will suggest a decline in operating income when in reality the company is experiencing explosive growth. So how do we fix this discrepancy? One method is to manually capitalize R&D based on your own set of assumptions which also leads to manually adjusting the historical operating income. Although it is a great solution, it is very time consuming. Nonetheless, there is a small shortcut you can use that will at least let you skip the step of adjusting the historical operating income. 5. b) Calculating Growth Rates
In our opinion, the best way to tackle tech companies is by first calculating the fundamental growth rate of revenue and then use the free cash flow to equity margin for your projections.
The calculation for revenue growth rate is similar to the one used for operating income but with slight differences. You start by calculating the reinvestment rate of revenue which is as follows: Reinvestment Rate of Revenue = (Research & Development + Acquisitions + Capital Expenditure - Depreciation & Amortization + Change in Non-Cash Working Capital) / Revenue As you can see, R&D has been added to the equation and NOPAT has been swapped out with revenue. The next step is to calculate invested capital: Invested Capital = Current Assets - Current Liabilities - Cash + Non-Current Assets However, some tech companies are extremely asset light which may result in negative invested capital. In this scenario, we will need to make adjustments in order to make this number positive. The adjustment is to capitalize R&D. In this step, you are required to use your best judgement to decide how long the R&D expenses should be amortized for. Assuming you decide a 5-year period makes the most sense for a particular company, the calculation will be as follows: Annual amortization as a percent = 1 / number of years (20% for this example) Total R&D capitalization equals the sum of: R&D Capitalized from Current Year (2020) = Full R&D Expense (FRE) R&D Capitalized from 2019 = FRE x 0.8 R&D Capitalized from 2018 = FRE x 0.6 R&D Capitalized from 2017 = FRE x 0.4 R&D Capitalized from 2016 = FRE x 0.2 Now that we have capitalized our R&D, we will include it in our invested capital calculation: Invested Capital = Current Assets - Current Liabilities - Cash + Non-Current Assets + Capitalized R&D The next step is to find the revenue to invested capital ratio. Similar to ROIC, we swap out NOPAT for revenue and use our newly calculated invested capital: Revenue to Invested Capital = Revenue / Invested Capital Now it's time to calculate the fundamental revenue growth rate: Revenue Growth = Reinvestment Rate of Revenue x Revenue to Invested Capital We would just like to note that you only would need to capitalize research and development if the invested capital calculated is negative. Otherwise, it would be more accurate to simply exclude this calculation. 5. c) Free Cash Flow to Equity
Once we have our revenue projections done, we can apply the company's FCFE margin to the revenues to arrive at the values needed for the DCF. Please note that FCFE is calculated as cash from operations minus CapEx plus net borrowings. This means that neither stock-based compensation or acquisitions have been accounted for. Therefore, you will need to make these adjustments if you feel they are material to the valuation. Generally, a multi-stage DCF is ideal for tech companies since they tend to grow at an accelerated rate relative to other industries.
6. How to Speed Up Your Valuation Process
As you can see, there are many different methods of valuations with many steps involved. Starting from scratch every time is what discourages many people from writing off valuations as "too much work" or "too time consuming".
Think about it, not only do you need to make numerous calculations, but you actually have to spend time finding the data. Then you have to actually build the DCF model and make adjustments where deemed necessary. On top of that, you should be looking though the company files to get a better understanding of how the company operates and how it stacks up against its peers. As a result, most retail investors never bother to learn how to perform valuations and willingly leave out half of the common sense investing equation which we define as investing in good businesses at a GOOD PRICE. The best investing tool (hands down) we have ever come across is Finbox.
As bloggers, investors, and Seeking Alpha writers, we are required to perform many valuations every month. For example, for every one article we post on Seeking Alpha, we have probably valued at least 5 others before determining which stock we want to write about.
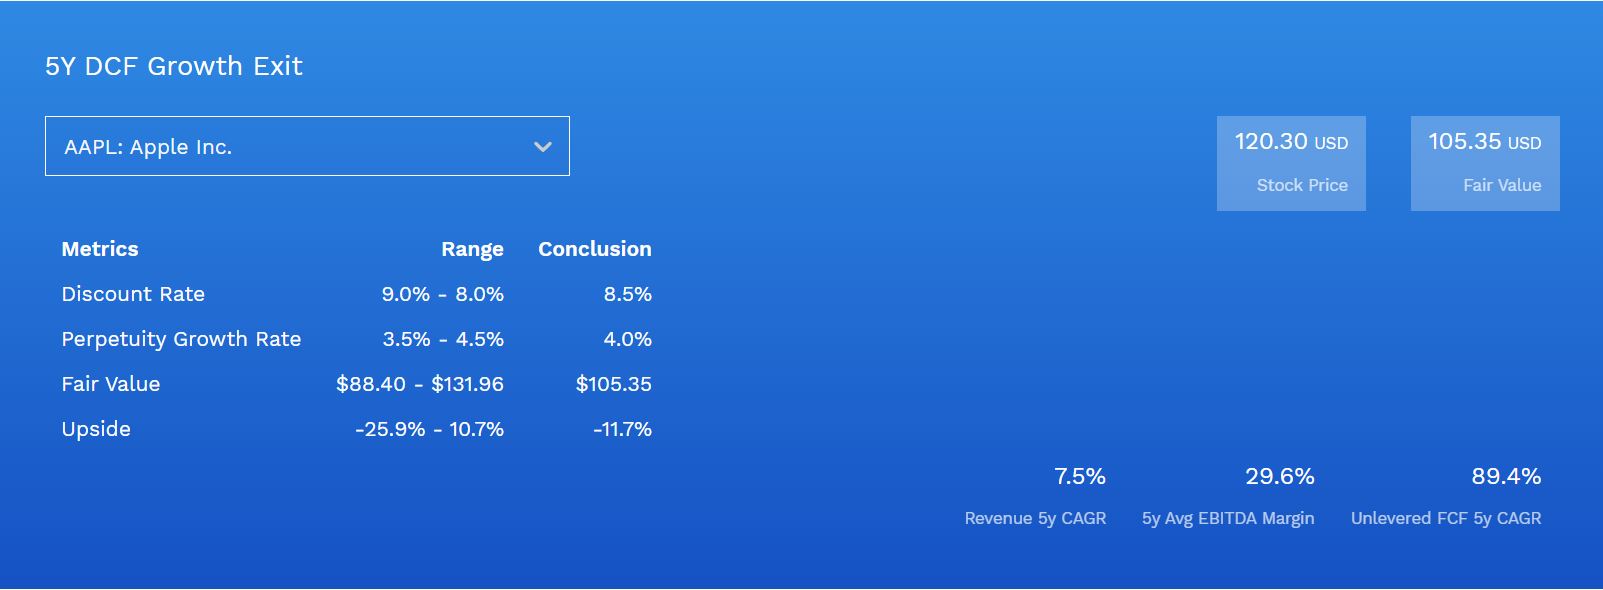
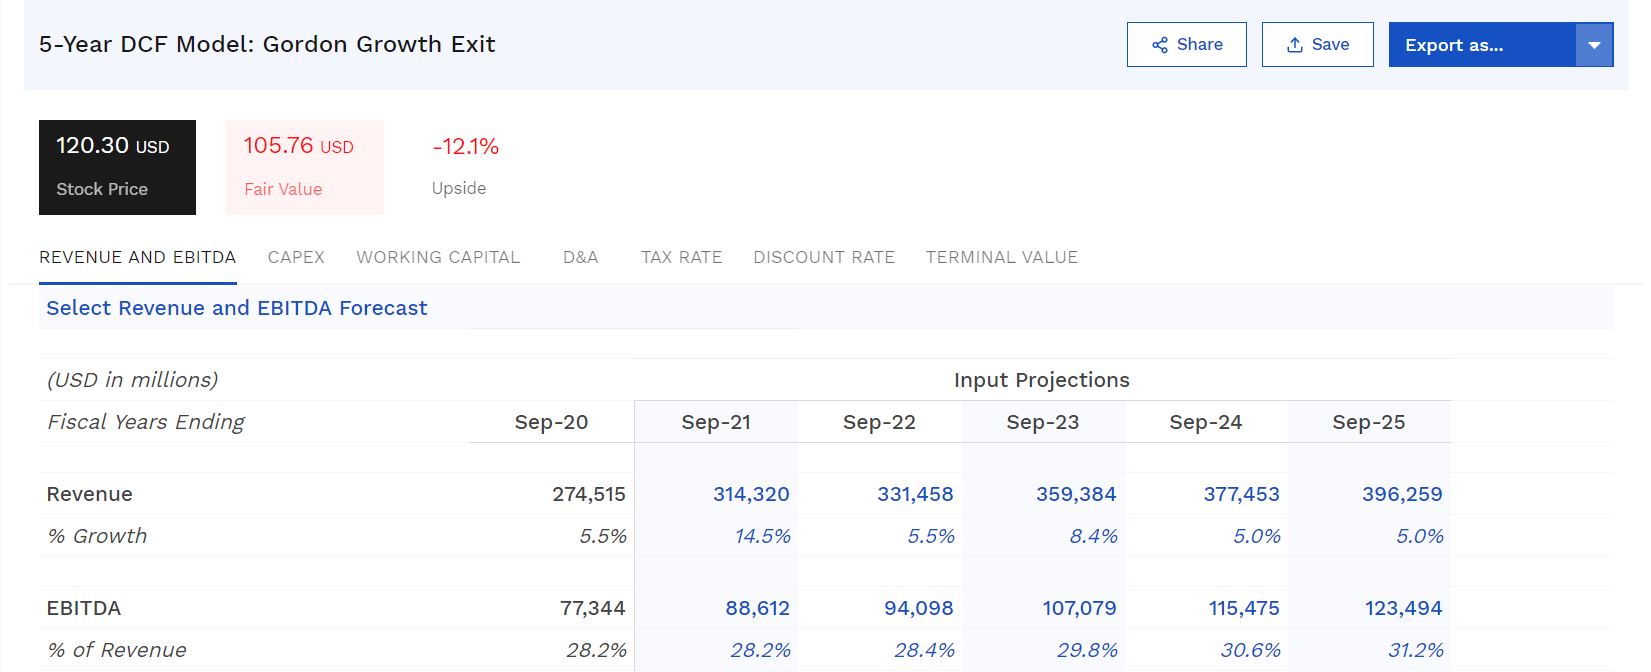
With Finbox, you can use their pre-built valuation models directly on their site which includes the DCF method in the "Putting it Together" section of this article. Below is an example of a 5-year, 2-stage DCF growth exit model that you can easily find on Finbox:
This first section is what you would find at the top of the page. As you can see, it summarizes the valuation and provides a range of possibilities depending on which discount rate and perpetual growth rate used.
As you scroll down, you will find the input projections that is set to analysts' estimates by default. However, you can manually change these inputs yourself directly on this page. If you take a look at the revenue growth for Sep-21, we manually set it to 14.5% just as an example. This is a great feature if you disagree with what the analysts are expecting. As you can see, there are tabs underneath the black and red price boxes which allow you to change many different variables as you please.
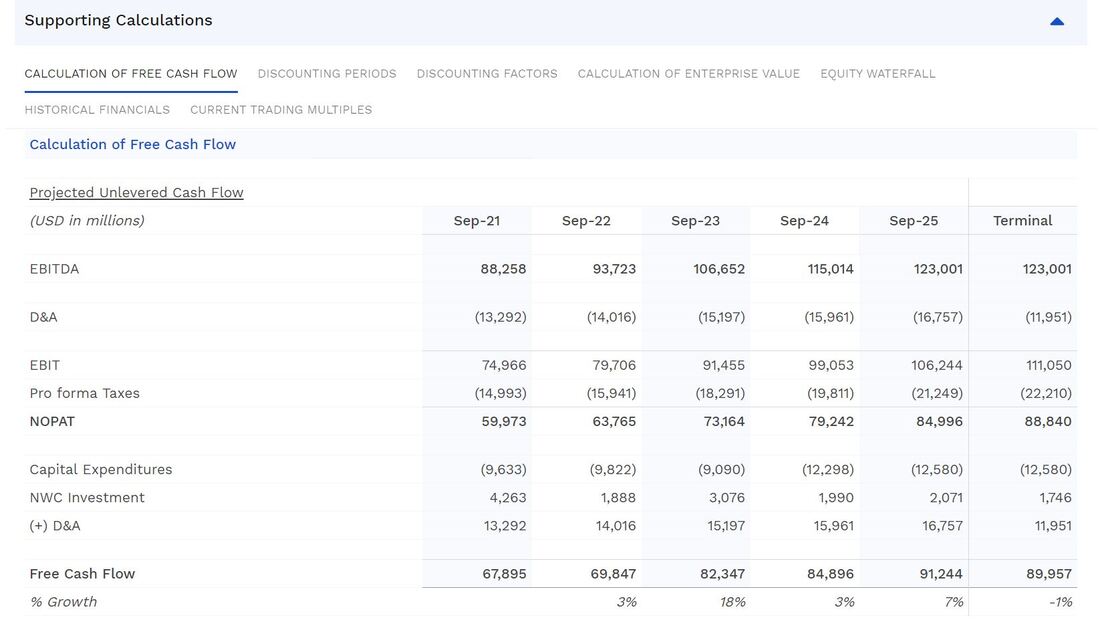
Finally, as you get to the bottom of the page, you will be able to see the supporting calculations for the valuation. This section also has multiple tabs which allows you to see how everything was calculated. This transparency is an excellent feature which will help you evaluate the validity of each price target provided by Finbox.
Finbox has a very large selection of 1000+ metrics, different valuation models, and up-to-date information on any stock in the world with over 900 million data points that are extremely useful to investors interested in the common sense approach to investing. It also provides advanced stock screeners, investment ideas, and more. With prices starting at $10/month, Finbox offers extremely great value. In addition, they offer a 10-day trial for $1 along with a 100% money back guarantee.
Get started with Finbox here. Thanks for reading! If you enjoyed this article, please consider subscribing to our free newsletter to get articles like this sent to you when they are posted! Related Articles |
Categories
All
Archives
September 2022
|




 RSS Feed