 If you do some searching for dividend stocks, you may find stocks that have dividend yields of 15% or more. To a beginner investor, stocks like this may seem like a bargain. However, it is often the case that the dividends for these high yielding companies are unsustainable and only high because the price of the stock has dropped due to poor fundamentals. There are a few ways to check if a dividend is safe, and this post will teach you just that. 1. Dividend Payout Ratio This is the simplest calculation to make in terms of dividend safety. The formula for dividend payout ratio is as follows: Dividends Per Share / Earnings Per Share OR Dividends Paid / Net Income The lower this number is, the better. Here's a quick example: Company XYZ: Net income = $100,000 Dividends Paid = $45,000 45,000/100,000 = 0.45 (this can be written as 45%) This means that 45% of net income is paid out as dividends, which is considered safe. Ratios higher than 60% can be a warning sign, however, this depends on the industry. More mature industries such as utilities or consumer staples may pay out more money in dividends compared to high growth stocks. The three main things to look for are: 1. Payout ratios that are not growing every year as growing ratios can imply an unsustainable dividend. 2. Payout ratios that are less than 100% (lower the better). 3. Payout ratios that are safe when factoring in the type of industry the company is in. Dividend payout ratios should be calculated using annual earnings rather than quarterly earnings as some companies might be seasonal and can have stronger performances in one part of the year compared to the other. Also, it is important to check if the earnings weren't affected by one time gains or losses (nonrecurring gains or losses) such as gains on the sale of a property, write-offs, etc. It is important to do this because if a company had abnormally high earnings in the most recent year due to a one-time gain, it will give you an artificially low number for the dividend payout ratio. Check through the company's recent annual earnings report along with their past earnings reports to see if the net income number is logical to use. Important note: Do not use dividends divided by net income for REITs. Net income for REITs is unreliable because of things that affect net income such as depreciation charges. Instead, dividends divided by Adjusted Funds From Operations (AFFO) or ACFO should be used. REITs often have high AFFO payout ratios but it is not a cause for concern unless their payout ratio is growing every year and higher than about 90%. 2. Free Cash Flow Compared to Dividends In our opinion, free cash flow is always a better metric to use instead of net income (except for financial stocks). The same way we calculate payout ratios using net income, we can calculate them using free cash flow. Again, if analyzing a REIT's dividend safety, only use Adjusted Funds From Operations, Adjusted Cash Flow From Operations (ACFO), or Funds From Operations (FFO) if you can't find AFFO/ACFO. FCF can often be volatile depending on the company so it's important to check more than one period's worth of free cash flow and see if it is always (or usually) higher than the dividend paid out. On top of that, you want to make sure that the average FCF annual growth rate is in line or higher than the average annual dividend growth rate to ensure sustainability. If a company has volatile FCF, it's good to use a 3-5 year average free cash flow divided by the current dividend. This isn't very necessary for a company that consistently has stable free cash flows, such as Johnson & Johnson. For JNJ you could use just 1 year worth of data instead of 3-5. Quick example for a FCF-volatile company: Year 1 FCF: $100,000 Year 2 FCF: $150,000 Year 3 FCF: $60,000 Average 3 year Free Cash Flow: (100000+150000+60000) / 3 = $103,333.33 **Year 3 being the most recent year** Current Annual Dividend: $90,000 3-year average FCF payout ratio: 90,000 / 103,333.33 = 87.1% This would indicate that on average for the last 3 years, FCF has been enough to cover the current dividend which is good (again, the lower ratio the better). Your next step would be to figure out why FCF dropped in the most recent year and figure out if it is just a temporary drop or a longer term cause for concern. 2b). Comparing FCF Growth to Dividend Growth. To calculate growth, we can simply do a compounded annual growth rate (CAGR) calculation. The formula for CAGR is: CAGR = (End Value/Start Value)^(1/Years)-1 **There are CAGR calculators available online, so you don't have to calculate it manually if you don't want to.** To keep it simple, let's use 3 years of data (5-10 years is better). Annual Dividend: Year 1: $80,000 Year 2: $83,000 Year 3: $90,000 For CAGR, all you need to know is the beginning value, ending value, and the amount of years that passed. With those 3 numbers, you can figure out CAGR using a CAGR calculator. Using the numbers above, the beginning value is $80,000, the ending value is $90,000, and the amount of years that passed is 2 years (from the end of year 1 to the end of year 3). If you compute the numbers, you will find that the CAGR for the dividend growth is 6.07%. Using the same method, you can calculate the CAGR for the FCF. The FCF CAGR should be higher than the dividend CAGR or at least very close to it to ensure sustainability. It's recommended to use 5 time periods for this calculation (or more, if feasible). Important note: **If a company has a one-time nonrecurring spike in FCF for whatever reason, you may want to ignore that year in your calculation and either use a different year or a more normalized number.** 3. Earnings Growth vs. Dividend Growth The final step would be to compare earnings growth to dividend growth. This can be done using the exact same CAGR formula described above. The only difference is that instead of comparing FCF to dividends, you compare net income to dividends. Again, we think FCF is more important than net income so we place a bigger weight on FCF. Nonetheless, it wouldn't hurt to find out if average earnings growth is the same (or greater) than average dividend growth to figure out if the dividend is safe. 4. Is the Company Projected to Grow/Remain Stable? The last thing to know is if the company is in a growing/stable industry. If you (or analysts) think that the company is going to grow going forward, either based on common sense or mathematical forecasting, then that is another sign that the dividend is probably safe. For dividend safety, you want to avoid companies whose income/free cash flow is projected to decline significantly over the next few years for whatever reason that may be. Conclusion Use these 4 methods above to determine if a dividend is safe. The most important of the 4 is free cash flow (#4 is also very important). Therefore, I MAY invest in a dividend stock whose earnings don't cover the dividend if the company is fundamentally sound besides that, but I WON'T invest in a dividend stock that can't cover its dividends with free cash flow. Ideally, you want all 4 of these things to line up. If you find a stock that passes these 4 checks, then you have a stock with a dividend you can trust. How to Easily Access Fundamental DataIf you're wondering where to find reliable financial data, we highly recommend using Finbox. Every metric discussed above (as well as many other useful metrics) such as dividend payout ratio, FCF payout ratio, dividend growth rate etc. can easily be found without having to do any calculations yourself. The information is easy to access and is laid out in an easy to understand format. Here's an example of MSFT's FCF payout ratio using Finbox. 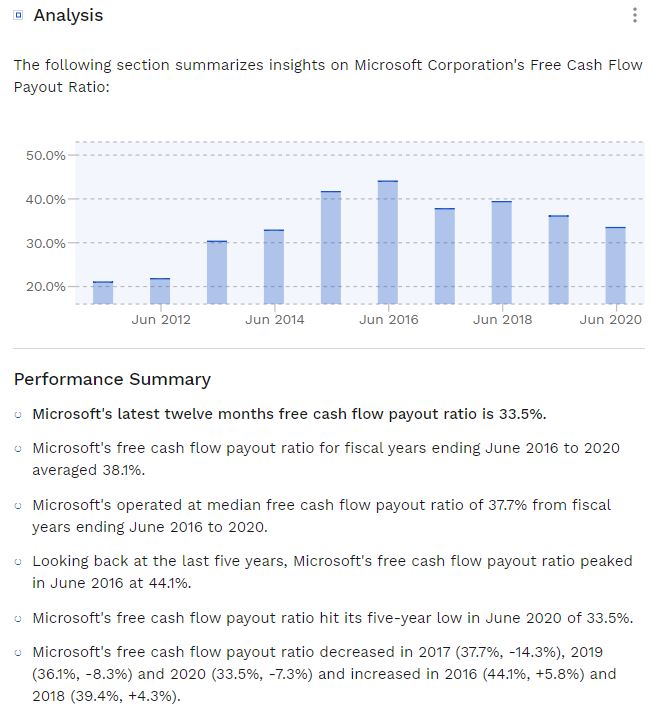 As you can see, it shows the past 10 years' worth of data with an easy to understand chart followed by a performance summary, making fundamental analysis a breeze. Thanks for reading! We hope this article helped you better understand how to analyze dividend stocks. If you enjoyed this article, please consider following us on twitter @StockBrosTrades and/or subscribing to our free newsletter to get articles like this sent to you when they are posted!  |
 Categories
All
Archives
September 2022
|
 RSS Feed