 The Relative Strength Index (RSI) indicator is one of the most popular and basic indicators out there. Most traders know about the RSI. However, does it really work? Spoiler: it can be profitable, but it’s probably not the best indicator out there.
 Want to short growth stocks? Here's a moving average trading strategy we backtested on Cathie Wood's ARKK ETF (using Puru Saxena's ideas as inspiration). This can potentially help you profit on both the long and short side. Check it out!
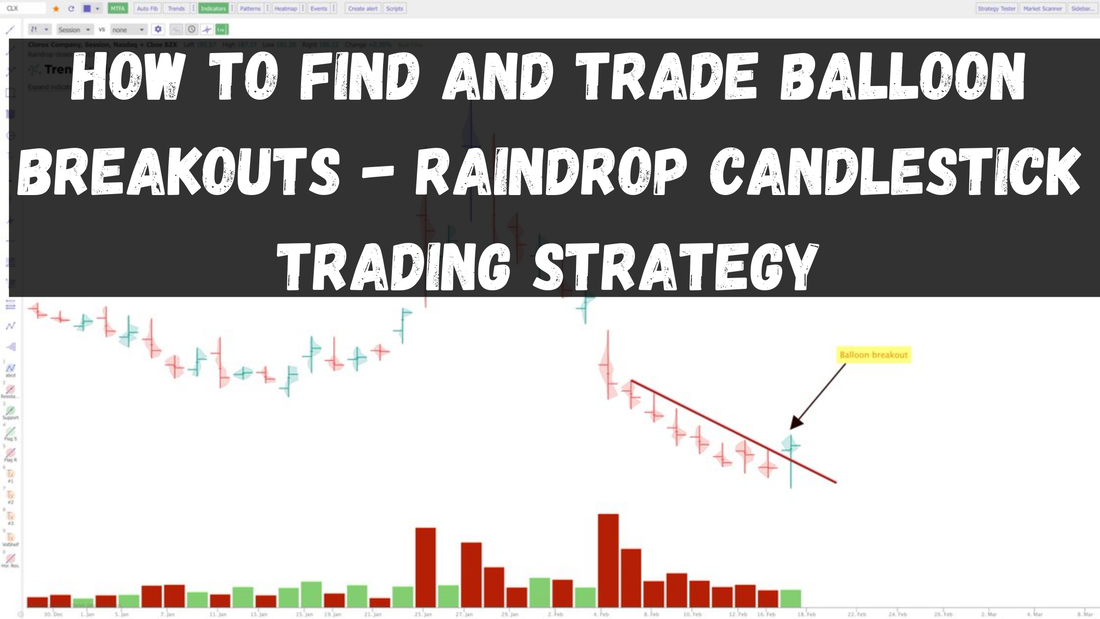
If you're familiar with Raindrop Candlestick Charts, you may be familiar with Balloon Raindrops. If not, don't worry, we'll explain the concept in this post and how you can screen for and use Balloon Raindrops in your stock trading strategy.
 People often wonder how to find stocks to trade or how to scan for complex criteria. We do weekly watch lists so we thought we might as well share some insight on how we scan specifically. This can apply to both day trading and swing trading.
Do Moving Average Crossover Trading Strategies Really Work? - Backtesting Golden Crosses and More3/18/2021
 Moving averages are probably the most common indicator used in trading strategies,whether its stocks, forex, or crypto. There are many ways to trade them such as using them as support/resistance levels, buying when the price crosses over a specific moving average, buying when moving averages crossover each other, and more.
 Have you ever thought of a stock trading strategy that could be profitable but you didn't want to waste the time or money to find out by actually trading it? Well, that's what backtesting is for, and no, you don't need to know how to code a strategy in order to backtest. Backtesting is easy and this post will show you how to do it. We'll even show the results of a simple MACD crossover strategy.
 Have you ever wondered what technical indicator can give you the extra edge that you are looking for when it comes to stock trading? Whether day trading or swing trading, for us, that indicator is volume. This post will show you how we like to use volume analysis for trading.
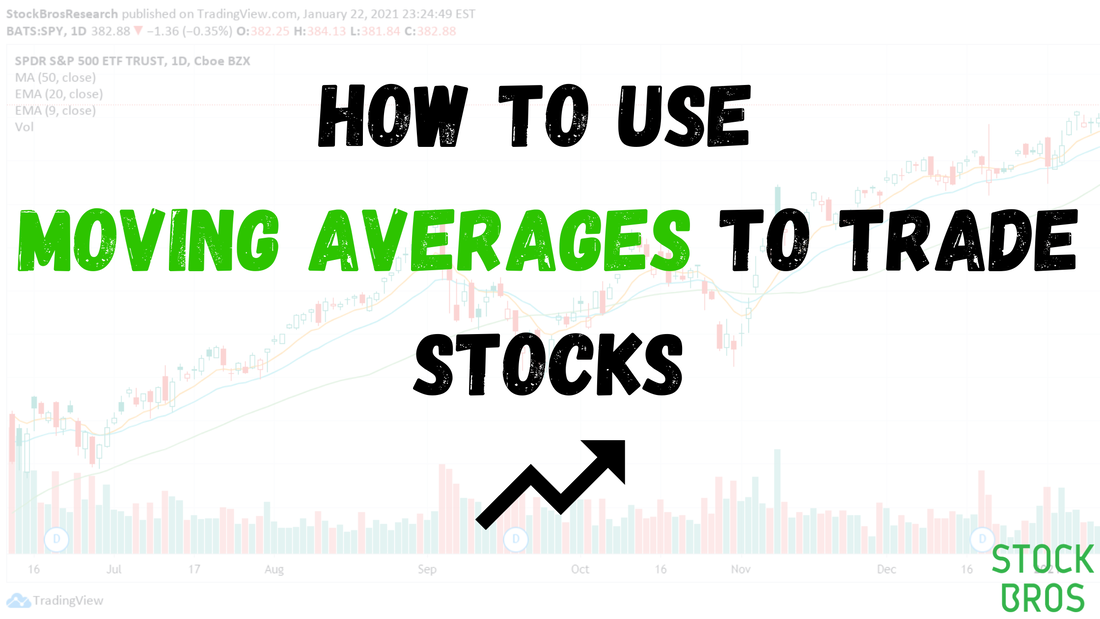 Moving averages are commonly used in stock trading. The 2 most common MA's are the Simple Moving Average and the Exponential Moving Average, which we will explain in this article.
Don't Use Hourly or 2-Hour Charts For Stock Trading. Use 65 And 130-minute Charts Instead.10/24/2020
 Traders often toggle between various time frames when analyzing a stock. Common time frames for traders are the weekly, daily, 4 hour, 2 hour, hourly, 30, 15, 5, and 1 minute charts. Swing traders often use the 60 minutes or higher, and day traders typically use 30 minutes or less. While 2 hour and hourly (60 minute) charts can be good for futures or forex trading, it does not make too much sense to use these for stocks. We'll explain why in this article.
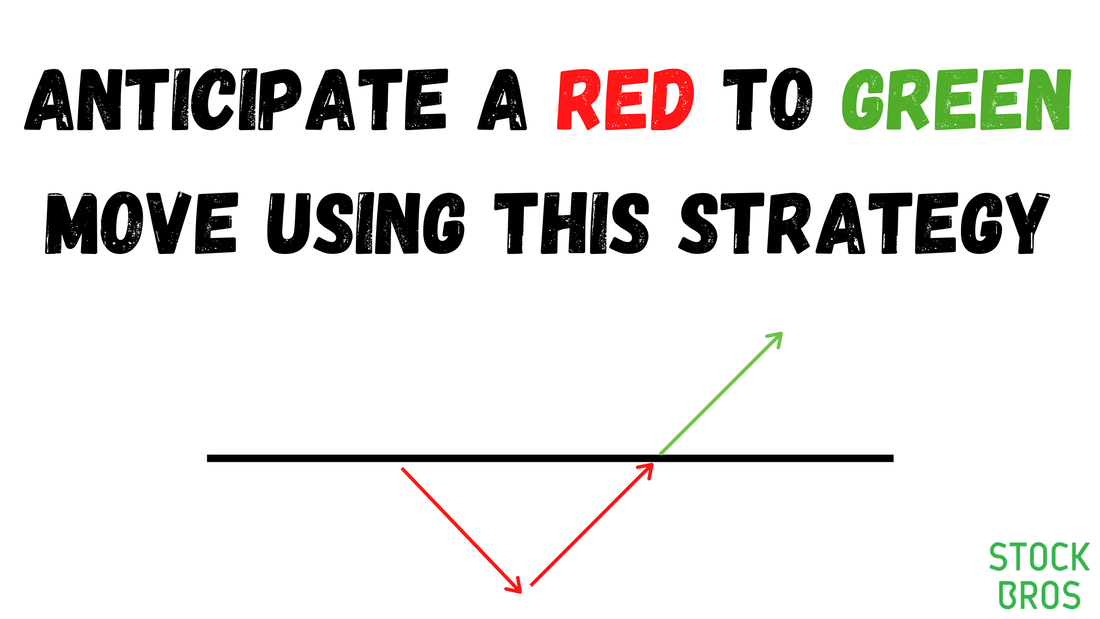 There are many trading strategies that people come up with that it can become quite overwhelming to know which one actually works best. Here's two red to green strategies that we know are good.
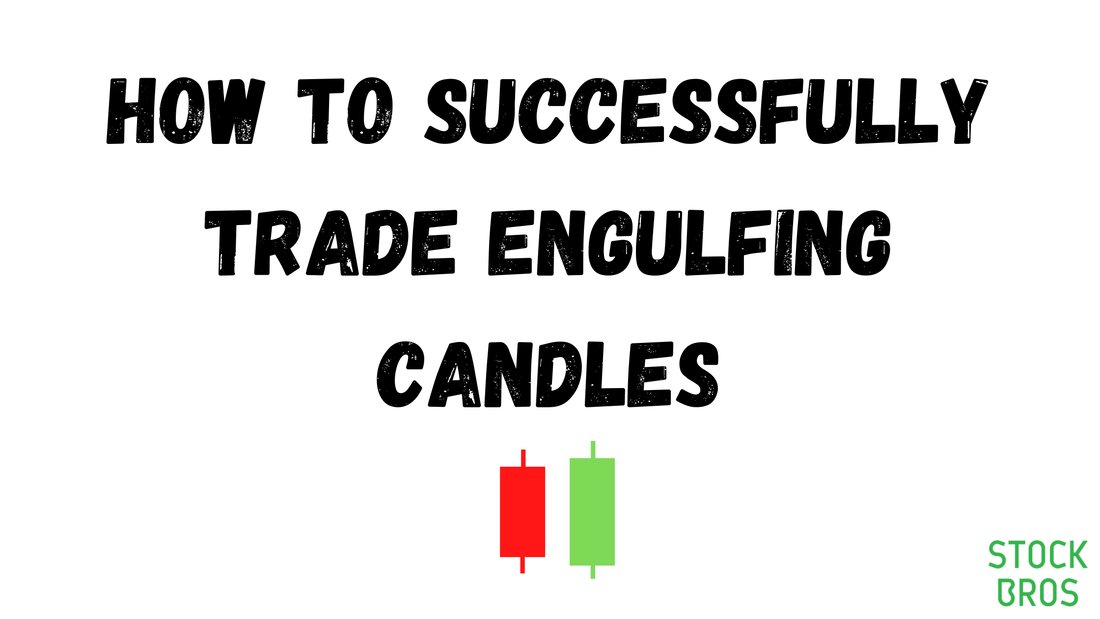 What is an engulfing candlestick and how can you use it in your trading strategy? There are two types: the bullish engulfing, and the bearish engulfing candle. A bullish engulfing candle can indicate a change in momentum to the upside. The opposite is true for a bearish engulfing candle. The pattern is made up of 2 candlesticks, where the most recent candle's body fully engulfs the body of the previous candle.
 In stock trading, a "short squeeze" is when a stock goes up significantly in a short period of time due to short sellers covering their short positions. When traders take a short position, they have a negative share position. To close their position entirely, they need to buy back shares in the amount that they are negative. If this happens all at once with many short sellers, it will create lots of buying which is known as a short squeeze.
 When it comes to the stock market, there are generally two types of participants: Investors and speculators. Speculators tend to use technical analysis while investors tend to use fundamental analysis. Which is better? Can you combine both? Learn more here.
|
 Categories
All
Archives
September 2022
|
 RSS Feed