 What is a PEG ratio? The price to earnings to growth ratio, or PEG ratio for short, is an indicator used in fundamental analysis in order to value a stock. It is a decent indicator but it does have a few drawbacks as we'll explain in this post. Keep reading to learn about a better way to use the PEG ratio to find undervalued stocks, in our opinion. Understanding the PEG RatioThe PEG ratio was developed by Mario Farina in 1969 and popularized by Peter Lynch in 1989. It is a quick calculation used to determine if a stock is trading at, above, or below fair value. The formula is as follows: PEG = (Share Price / Earnings Per Share) / Expected Earnings Growth Or simplified as: PEG = PE ratio / Expected Earnings Growth A ratio above 1 suggests that a stock is overvalued while a ratio below 1 means it is undervalued. It's a convenient rule of thumb if you are confident in the stocks growth estimates and a solid fundamental understanding of the company's business. There are some obvious drawbacks to this formula. For starters, it completely ignores risk factors such as standard deviation or company specific operational risks. In addition, it assumes that the stock will continue trading at the same PE ratio in the future. The markets are always changing and the multiple can easily change at any moment. However, there are ways to address these issues. A great way to approach this valuation method is by using a linear regression. By regressing the P/E ratios and expected earnings growth of companies within an industry, you can arrive at a better estimate of fair value relative to a company's competitors. Moreover, you have the option of adding more complexity to the equation by including other factors such as standard deviation and dividend yields using a multiple linear regression. An Example of How We Use ItRegression analysis can be done fairly easily through excel or google spreadsheets. Although not required to perform the calculations, we like to use Finbox's spreadsheet add-on. This helps us save a lot of time by automatically pulling the reliable data that we need. In addition, we can save the template for future use. *Please note: As of 2021, the Finbox function is not available for new customers. However, it is not necessary for this valuation method, it just makes it easier.* Let's perform a valuation for Huntington Ingalls Industries, Inc (NYSE: HII). The first thing we need to do is make a list of competitors which for the sake of the example we will limit to 10. We do recommend using at least 10 data points per independent variable. So if you're doing a multiple linear regression using standard deviations and earnings growth, you would need 20 data points. This will take us seconds with the following Finbox function: 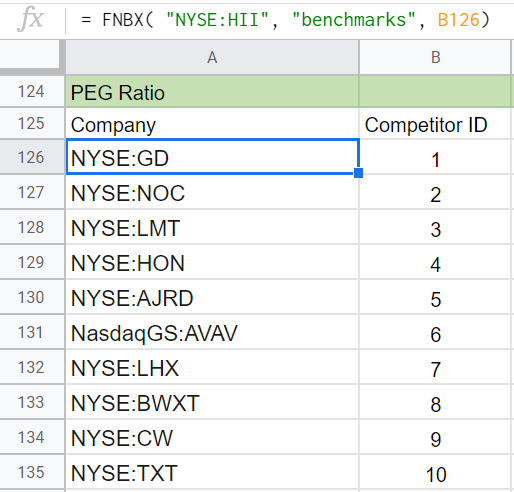 Alternatively, you can manually search up each competitor and plug it into the cells. Next, we will need the P/E ratios: 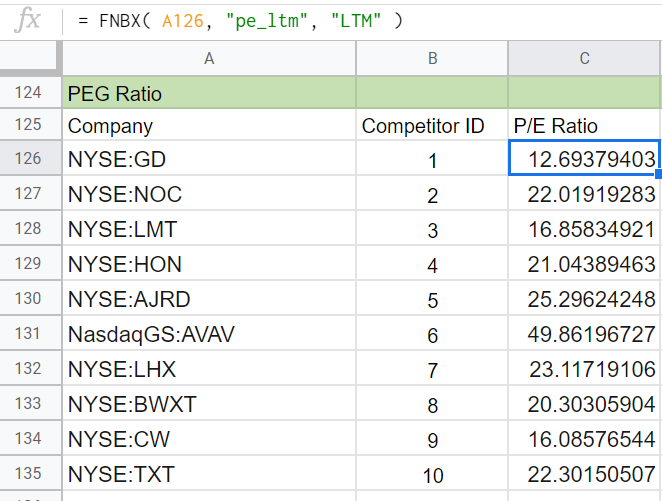 For expected earnings growth, we will use the consensus estimates for next year: 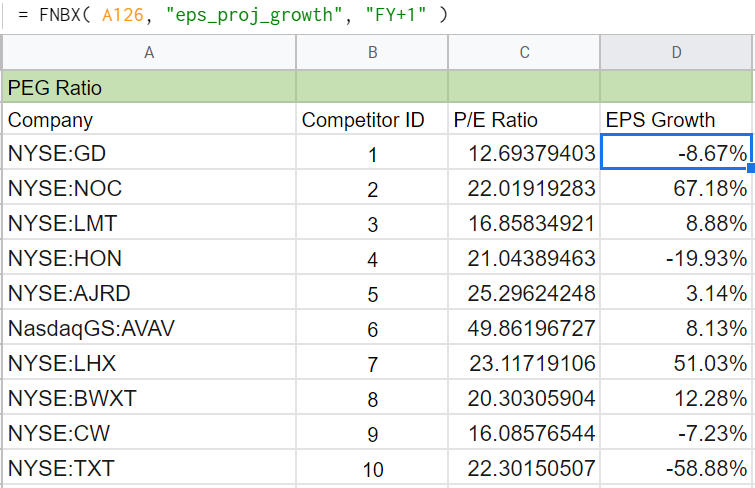 The next step is to create a scatter plot graph using EPS Growth as the independent variable and P/E Ratio as the dependent variable. 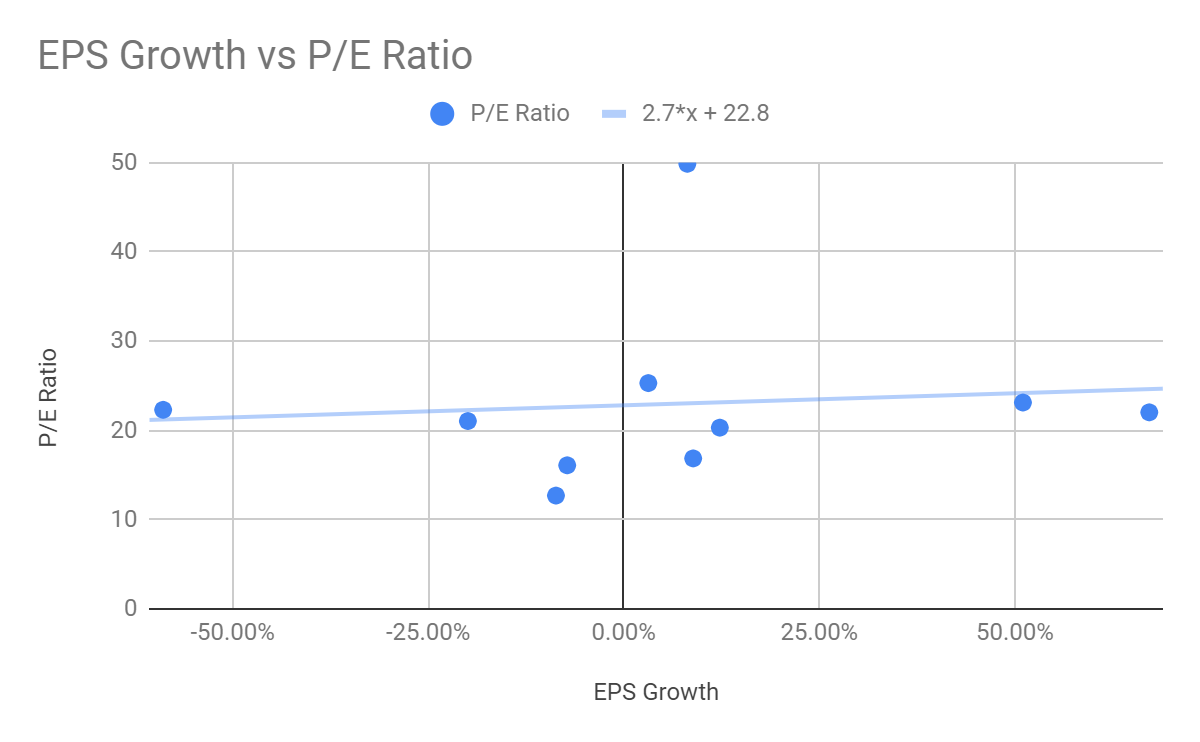 As you can see, the formula for the line is displayed near the top which we will use to calculate Huntington Ingalls Industries' P/E fair value. The company has a growth rate of 8.20%, which when plugged into the equation returns a fair value of 23.02 times earnings. 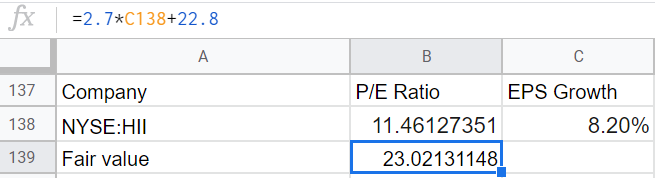 With the stock currently trading at 11.46 times earnings, we can say that the stock is undervalued using this method.
However, it is important to note that this is better used as a starting point. Once we like the valuation, the next step is to dig deeper into the company's operations and determine if there is a measurable competitive advantage. This is crucial because it will help determine if the company is a value stock or simply a value trap that will continue declining without ever bouncing back to the upside. Thanks for reading! If you enjoyed this article, please consider subscribing to our free newsletter to get articles like this sent to you when they are posted! You can also give us a follow on twitter @StockBrosTrades. |
 Categories
All
Archives
September 2022
|
 RSS Feed