 The market has had its worst week in a while. The Dow Jones fell 12.36% in 5 days. It all started the week earlier on Friday when there was a random sell off intra-day on no news. That random sell-off, although relatively small compared to this past week, sparked our attention enough to close some of our positions. Then the market started to sell more the next trading day (Monday, Feb 24th). At the same time, bond market yields were dropping at an alarming pace, hitting historic lows. The next day sold off again. We then closed all our positions on the relief bounce on Wednesday the 26th, just before things got really ugly. In fact, we went short after. 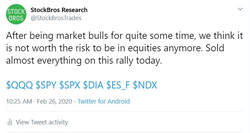 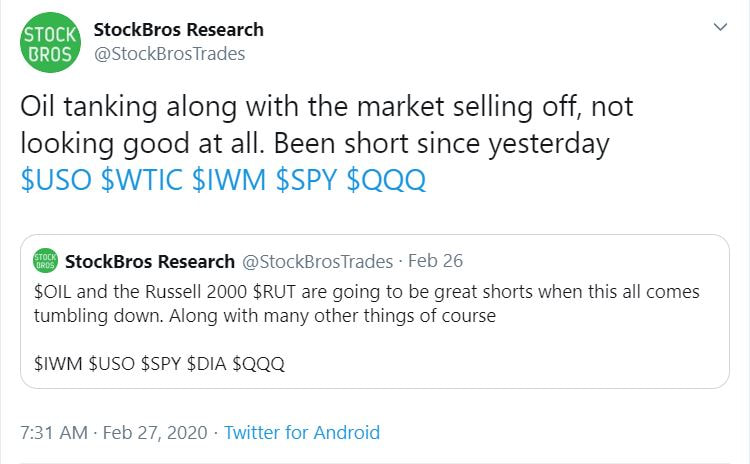 Why did we sell? The first being that big sell-offs on high volume should never be ignored. Especially when they start on no news intra-day. Also the yield curve has been inverted for quite some time. The market usually rallies after an inversion but eventually ends up crashing 7 to 24 months later. It's been longer than 7 months since an inversion has happened so it is better to stay on the safe side. There is also the coronavirus. Whether the coronavirus is going to be a pandemic or not is hard to say, but sometimes it's better to stay on the safe side and wait for the storm to settle or for the market to correct a large amount before getting back in. Lastly, oil recently broke a key support and dropped below $50. Oil is a critical part of the market and it's not a good sign to have oil in a downtrend. We are only holding gold and a small percentage of mining stocks. These can also see selling pressure in the short-term if the market continues to crash but we are in these for the long-term. Technical Levels To Watch 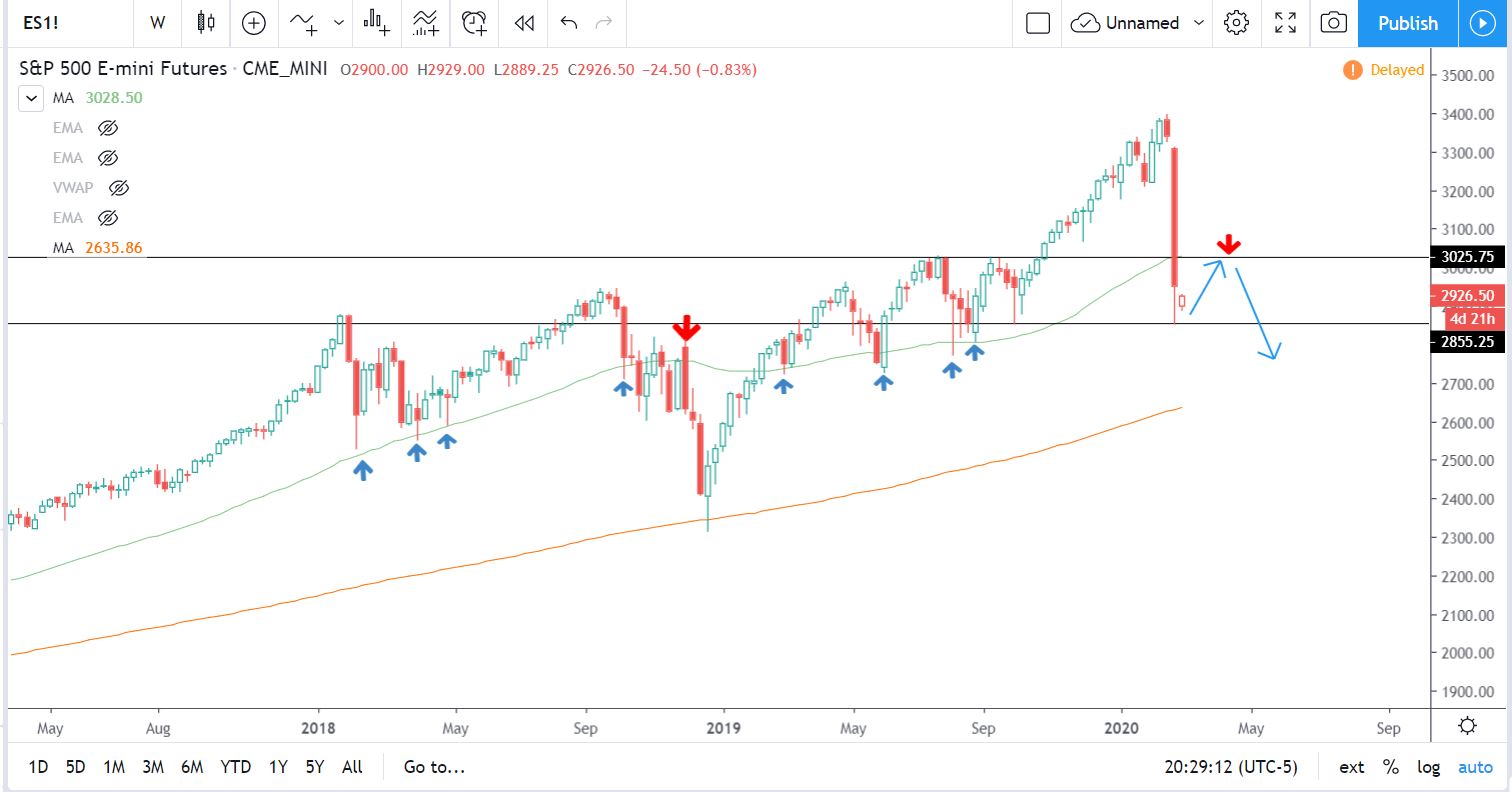 3025 is a key horizontal resistance point. That same price area is also in line with the 50 simple moving average on the weekly time frame. The 50 SMA is a good indicator for the S&P 500 because it usually acts as a support in an uptrend or resistance in a downtrend. As you can see, the blue arrows are past times the 50 SMA has acted as support, and the one red arrow was a resistance that caused a big sell-off.
This week, the S&P went under its 50 SMA again. That means it is likely to act as resistance around 3025 where the moving average and horizontal resistance are. Look for a bounce in price this week that resists around 3025. If there is enough resistance there, it will be a good short and the SPX will make likely make new lows. If price does not bounce at all, that means there are no buyers at all even after a big drop that we experienced. That will be even more worrisome for the market and may spark a bigger sell-off. |
 Categories
All
Archives
September 2022
|
 RSS Feed