 The last few weeks have been volatile for the markets. Now that we’re entering earnings season, things are about to get even more volatile. You may be wondering if the market is overvalued, undervalued, or fairly valued. Hopefully, this post can help give you an idea. Back on October 1st, we wrote a post here, where we explained a valuation method that we came up with for valuing the S&P 500 (SPY). The fair value we came up with for the S&P 500 then was $4,530. At the time, it was trading at $4,310. Then, it recently hit a high of $4,820 on January 4 before pulling back. Interestingly, the market had shown support near the $4500-4530 level in Nov-Dec. Coincidence? Probably. But, it’s cool to note regardless. Anyways, we suggest you read that post if you’re interested because it will familiarize you with the valuation method we’re about to show. We aren’t really going to go into detail about it here, we’re just gonna get to the calculations. Here’s our newest fair value calculation on the S&P 500. S&P 500 ValuationSpoiler: The fair value we calculated this time was $4,996. Current price = $4,674 But, keep reading to see the calculations! Also, note that this is just one quick method of analyzing the market. This is not set in stone. Here we go: So, the fastest way to value companies is by using multiples. Thus, we need to figure out what the right multiple should be. We will begin by setting earnings to 1 to represent 100% of all the profits earned by companies in the S&P 500. Next, we will need a discount rate. As discussed in the post we linked above, the CAPM formula can be simplified as follows: Risk-free rate + Equity risk premium At the time of this writing, the 10-year yield is 1.79% and the equity risk premium is 4.4% as per S&P Global, which equals a discount rate of 6.19%. If we didn't want to factor in growth, we could simply say that the fair value of the S&P 500 is 16.15 times earnings: 1 ÷ 0.0619 = 16.15 However, that's incomplete because growth expectations are important. Since the market tends to look 6-12 months ahead, we will incorporate growth for the next 12 months. For growth estimates, we will use analyst estimates which can be found here. The latest reporting period for S&P 500 earnings is September 30, 2021. As of that date, the trailing twelve months’ EPS for the S&P 500 is $175.37. Looking forward to September 30, 2022, EPS is expected to come in at $201.88 on a NTM basis. This represents an expected 15.1% growth rate. The forward estimates are bound to change as more info comes out. This is especially true now as earnings season is starting. So, keep an eye on the estimates using that link provided in the numbers above. You can’t just stop at next year’s forward earnings though because earnings are likely to continue growing in the long run. Therefore, we will need a perpetual growth rate, which we set to 2.125%. We arrived at this number by using the 30-year Treasury yield as a proxy for long-term growth expectations. This number fluctuates constantly, you can check the current 30-year yield here. Since 30-year bonds are the longest duration bonds, it makes sense to use their yield as the perpetual growth rate. Fair Value = (1 + NTM growth) ÷ (discount rate - perpetual growth rate) 28.49 = 1.151 ÷ (0.0619 - 0.0215) At the time of writing, the S&P 500 is trading at about 26.65x earnings (calculated as follows: 4674/175.37 = 26.65) which means it's still below the fair value of 28.49x that we just calculated. A multiple of 28.49x implies a fair value price of about $4996 for the S&P 500. Will the S&P 500 get near $5,000 relatively soon? It’s possible, but then it’d have to be renamed the S&P 5000; it only makes sense. However, we’re not making any predictions here, so don’t tell us that we told you it’s going to $4,996, unless it actually goes to $4,996, then feel free to give us credit ;). But really, we’re just presenting you the numbers based on analyst estimates. The beauty of this approach is that you can automate the inputs on Excel or Google sheets and see the fair value change in real-time and thus be ready for sudden changes in market conditions. Some Extra Things to Note Besides ValuationThe Trend: Despite some bearish macro developments recently, such as 7% inflation for December, the S&P 500 remains in an uptrend. Here’s a weekly timeframe chart. The market is still above its 30-week moving average (the green line) and it has trendline support and horizontal support below. Therefore, it still has potential to continue rallying. If it breaks down under the 30 SMA, then we’d start getting more concerned for sure. 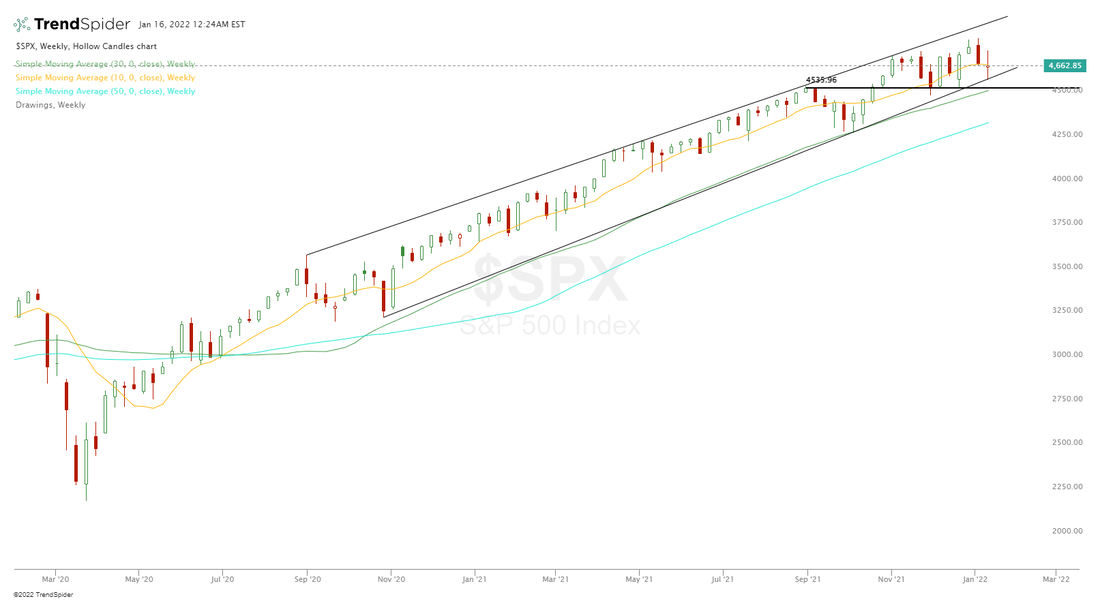 Market Sentiment: Right now, the fear & greed index is neutral. As you would guess, this measures fear & greed in the market. Extreme greed is generally a bearish sign and extreme fear is generally a bullish sign. We’re sure you’ve heard the phrase, “Buy when there is blood on the streets.” 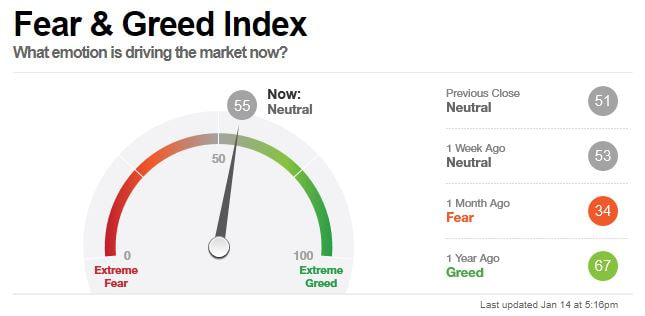 Overall, with our valuation method giving a $4,996 target, an up-trending chart, and neutral sentiment, we wouldn’t rule out the market rallying near $5,000. We ourselves are fairly neutral on the market and are taking things day by day, looking for setups that are more predictable right now. ConclusionThere are limitations to our valuation approach, which we outline here. Rising interest rates and equity risk premiums could drag the fair value multiple down, so that’s something you’d ideally want to factor in. Overall though, it’s a quick way to get a sense of market valuations. Although people will have their beliefs about valuations, sometimes it’s better to listen to what the market is telling you rather than trying to tell it what to do. This is one of many ways of listening to the market. We don’t solely rely on this; we use chart analysis a lot as well, as shown above. But, we want to reiterate here: this is not financial advice and we are not claiming the S&P 500 will hit near $5,000. Do your own due diligence and come to your own conclusions. Thanks for reading! If you enjoyed this post, consider sharing it or giving us a follow on Twitter. And here’s 10% off TrendSpider using code TS10 when signing up. Good luck to all!
|
 Categories
All
Archives
September 2022
|
 RSS Feed