There's currently a lot of commotion regarding the yield curve. With large investors focusing on the inversion of the 2-year and 10-year government bond spreads, it's worth discussing the importance of this event because the yield curve has been used for decades as a leading indicator of economic outlooks. The inversion of the 2-year to 10-year spread – which is when the 2-year government bond yields a higher return than the 10-year government bond – is seen as a harbinger for recessions. This is because the inversion has predicted the previous recessions of 1981, 1991, 2001, 2008, and 2020 (although COVID-19 was the catalyst for 2020). Nonetheless, investors watching the curve would've been ready for a recession despite whatever the true catalyst was. An inverted yield curve is an unusual event because, logically, investors should want to receive a higher return on long-term investments than on short-term ones. However, when investors begin to have a negative outlook on the economy, it causes them to start parking their money in bonds which pushes the yields down. More specifically, investors start buying up longer-term bonds. The logic behind this is that recessions last an average of 18 months. Therefore, investors can at least theoretically guarantee an income over that period. Furthermore, when looking at lending activities, financial institutions "borrow short and lend long," meaning they will borrow a short-dated loan because it should have a lower interest rate and lend at a longer time frame at a higher rate. The spread between the borrowing and the lending is the profit. A flattening yield curve reduces lending profits, which may lead to reduced lending activity. Does an inverted 2-year and 10-year spread guarantee a recession? The answer is no because the yield has inverted twice without it being followed by a recession. Why the 3-Month and 10-Year Spread is a Superior IndicatorAlthough most investors continuously watch the 2-and-10 spread, they often overlook the spread between the 3-month and the 10-year bonds. Unlike the 2-10 spread, which has been wrong twice, a 3-month and 10-year inversion has never been wrong so far. All 8 of the recessions in the US since 1970 (up through 2020) have been preceded by an inverted yield curve (10-year vs. 3-month). 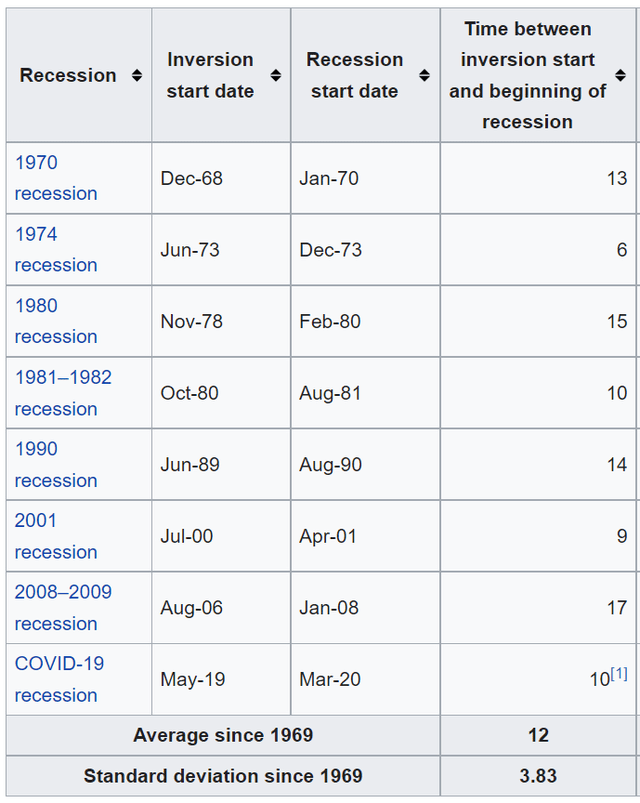 Wikipedia Yield Curve The reason for this is likely because the 3-month yield closely follows the Federal Funds Rate, which is the interest rate that banks charge each other to borrow or lend excess reserves overnight. For the 3-month yield to climb higher than the 10-year yield, it means the Federal Reserve has raised the Federal Funds rate above the 10-year yield. Since the 10-year yield is often used as a proxy for long-term growth expectations, an even higher Federal Funds rate means that the cost of borrowing is higher than the expected growth rate. In our view, this would suggest that the Federal Reserve has tightened too much, thus, eventually leading to a recession. This leads to the expression, "Bull markets don't die of old age, but rather they're killed by the Federal Reserve." Currently, the spread between the 3-month and the 10-year is very wide since the Federal Funds Rate is still 0.25-0.50%. At the time of this writing, the 3-month yield is 0.53%, while the 10-year yield is 2.38%. However, the market is expecting the Federal Funds Rate to climb very quickly based on the Fed Funds Futures contracts. The market expects it to be 2.49% by January 2023 (calculated as 100 - 97.51), which is less than a year away. 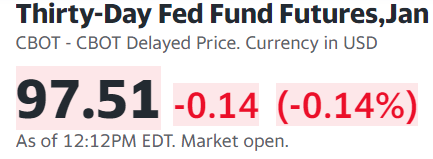 Source: Yahoo Finance If the 10-year yield remains near its current levels, then we could see an inversion in January. With a lag time between 6-17 months from inversion to recession, we would likely see a recession by mid-2023 to mid-2024. However, that's if the inversion happens. Final ThoughtsAs a result, we currently don't see a recession in the cards for 2022. A more likely scenario is that we simply see a slowdown in growth, and that high-quality stocks that can perform well in all market conditions will likely outperform. Thanks for reading. Hope you found this post useful!
Be sure to check out simplywall.st, TipRanks, and Finbox for fundamental analysis, and TrendSpider for charting software! If you use our special link for simplywall.st, you will get a 14-day extended free trial and unlimited company views, meaning you can analyze all the stocks you want using their tools (which we use all the time). Our other fundamental analysis articles here: |
 Categories
All
Archives
September 2022
|
 RSS Feed