|
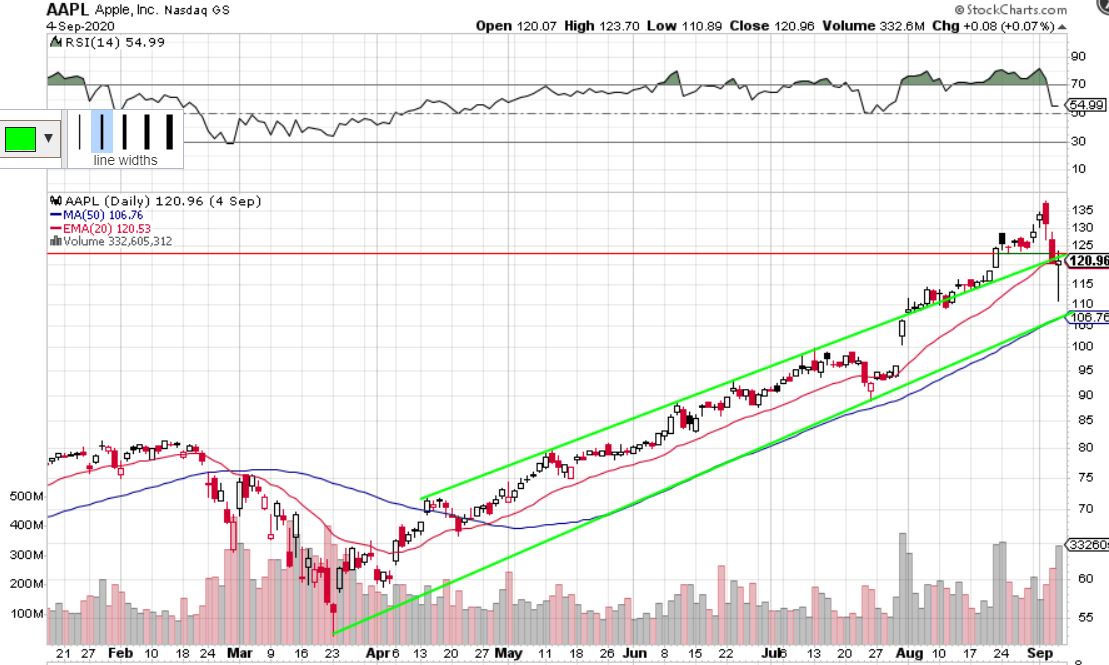
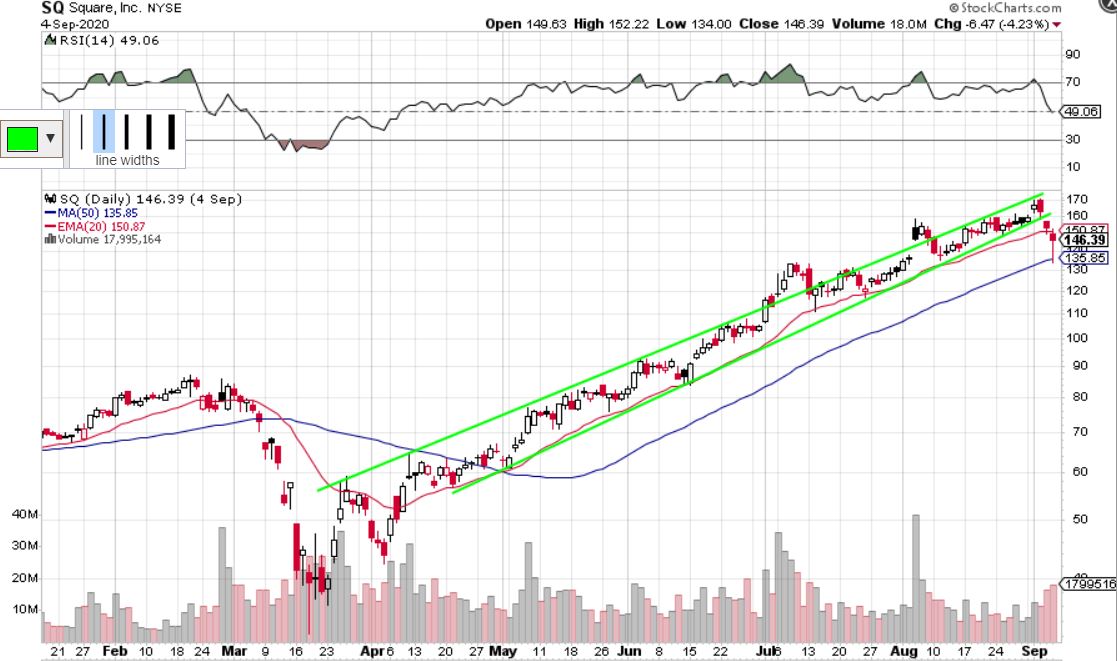
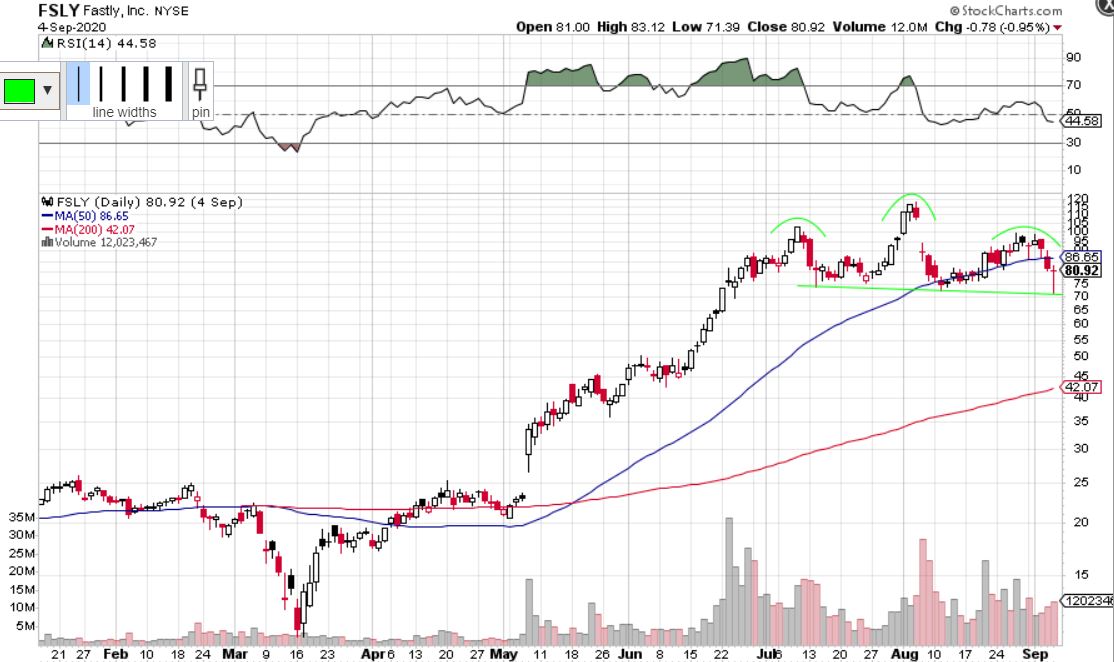
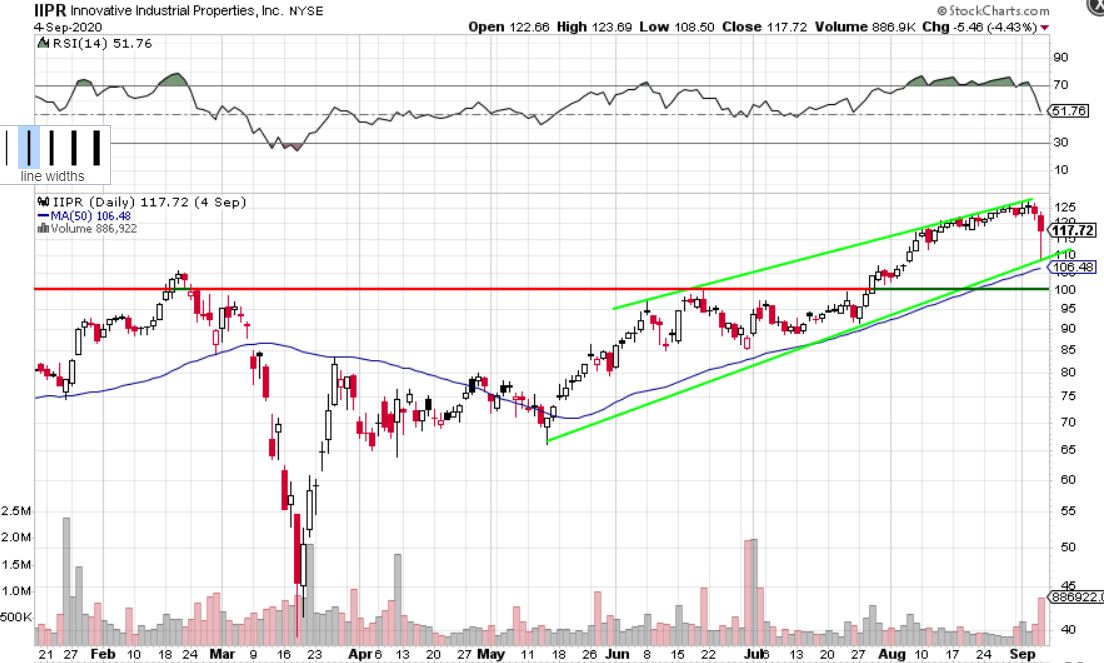
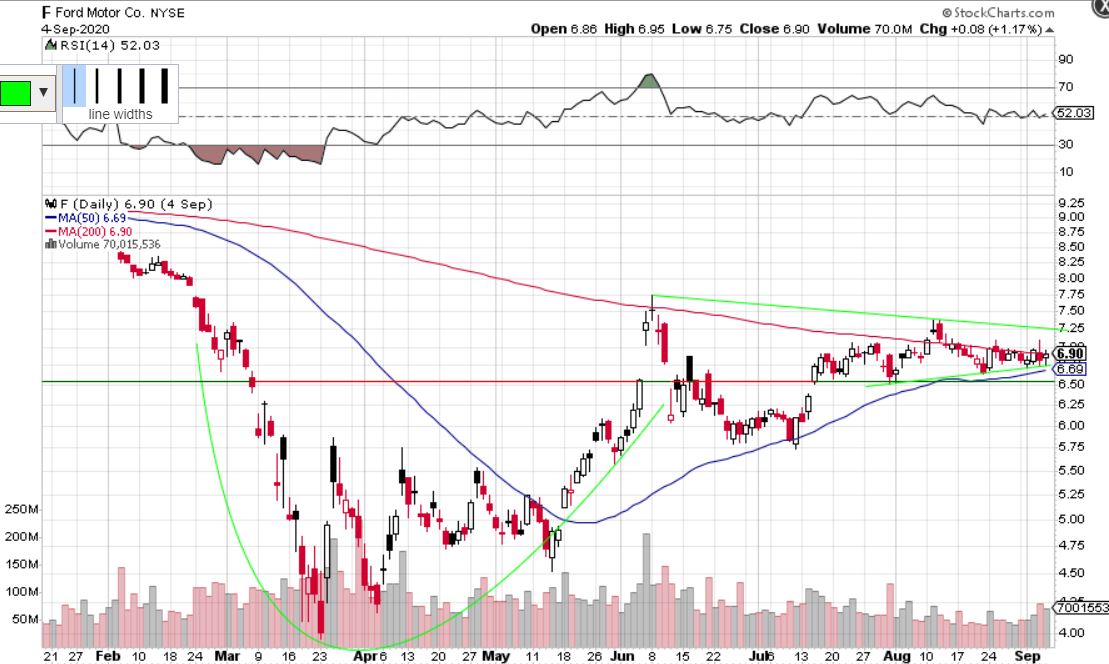
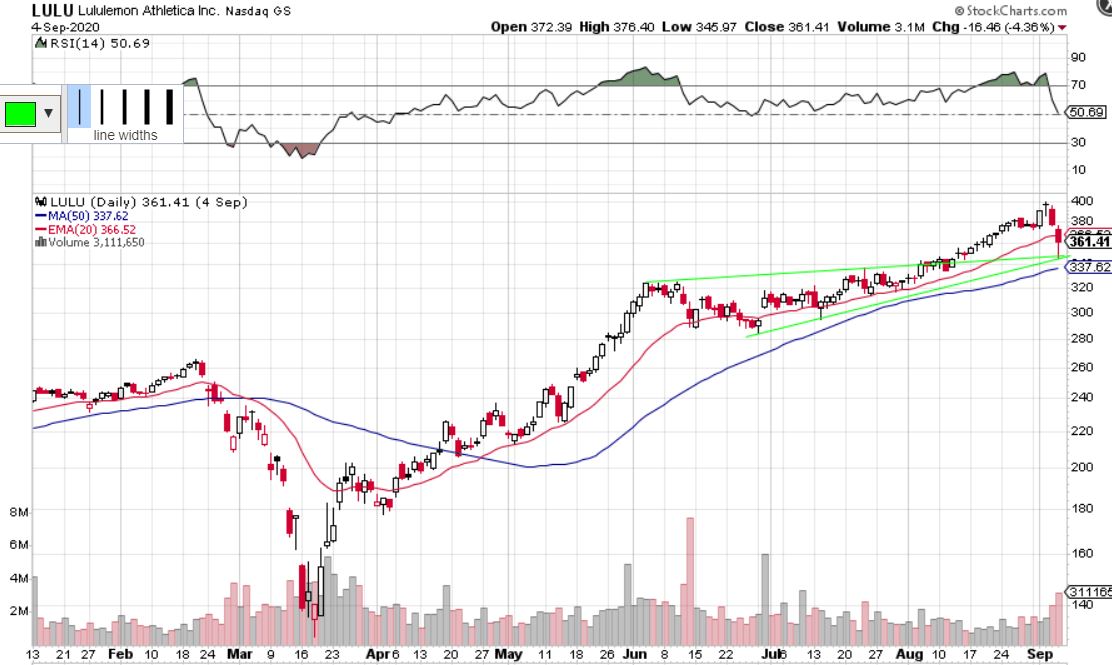
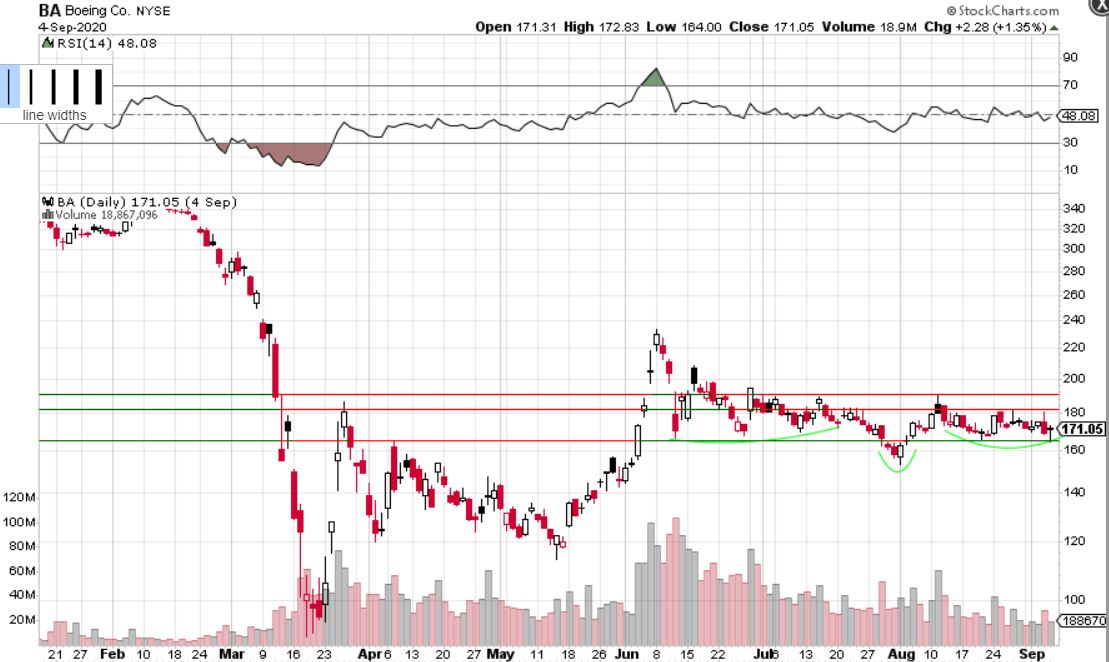
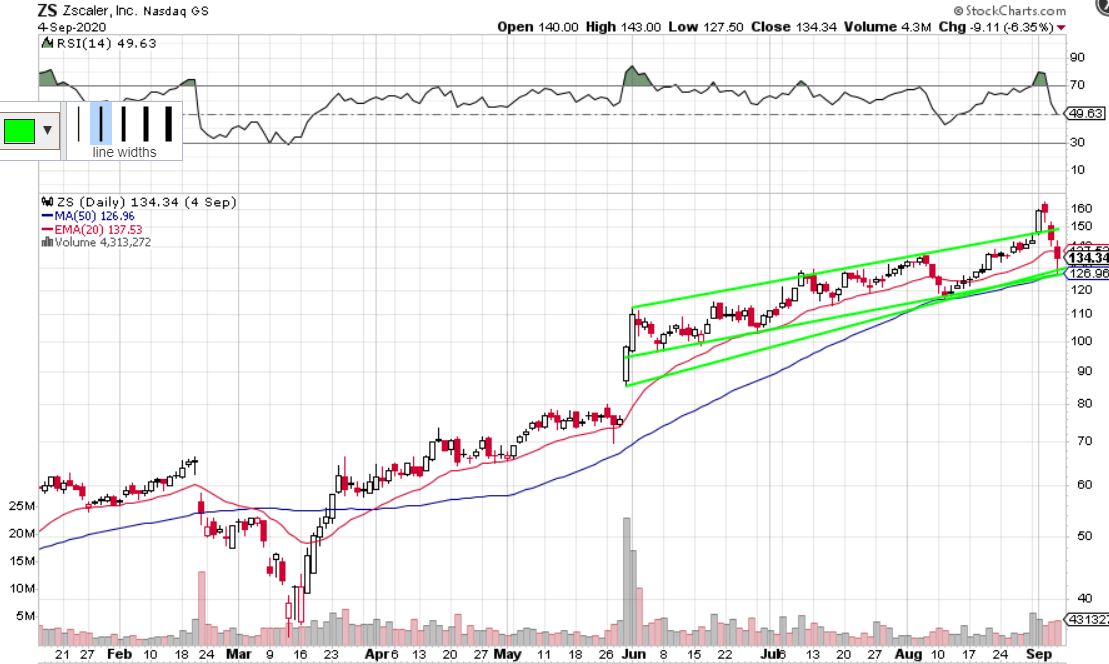
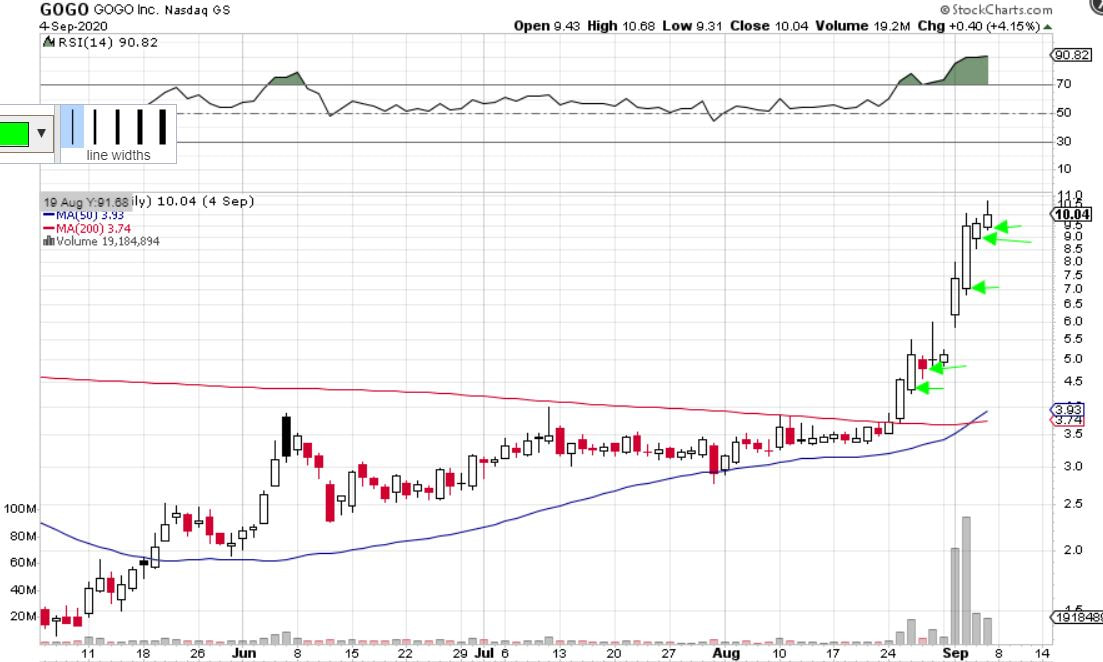
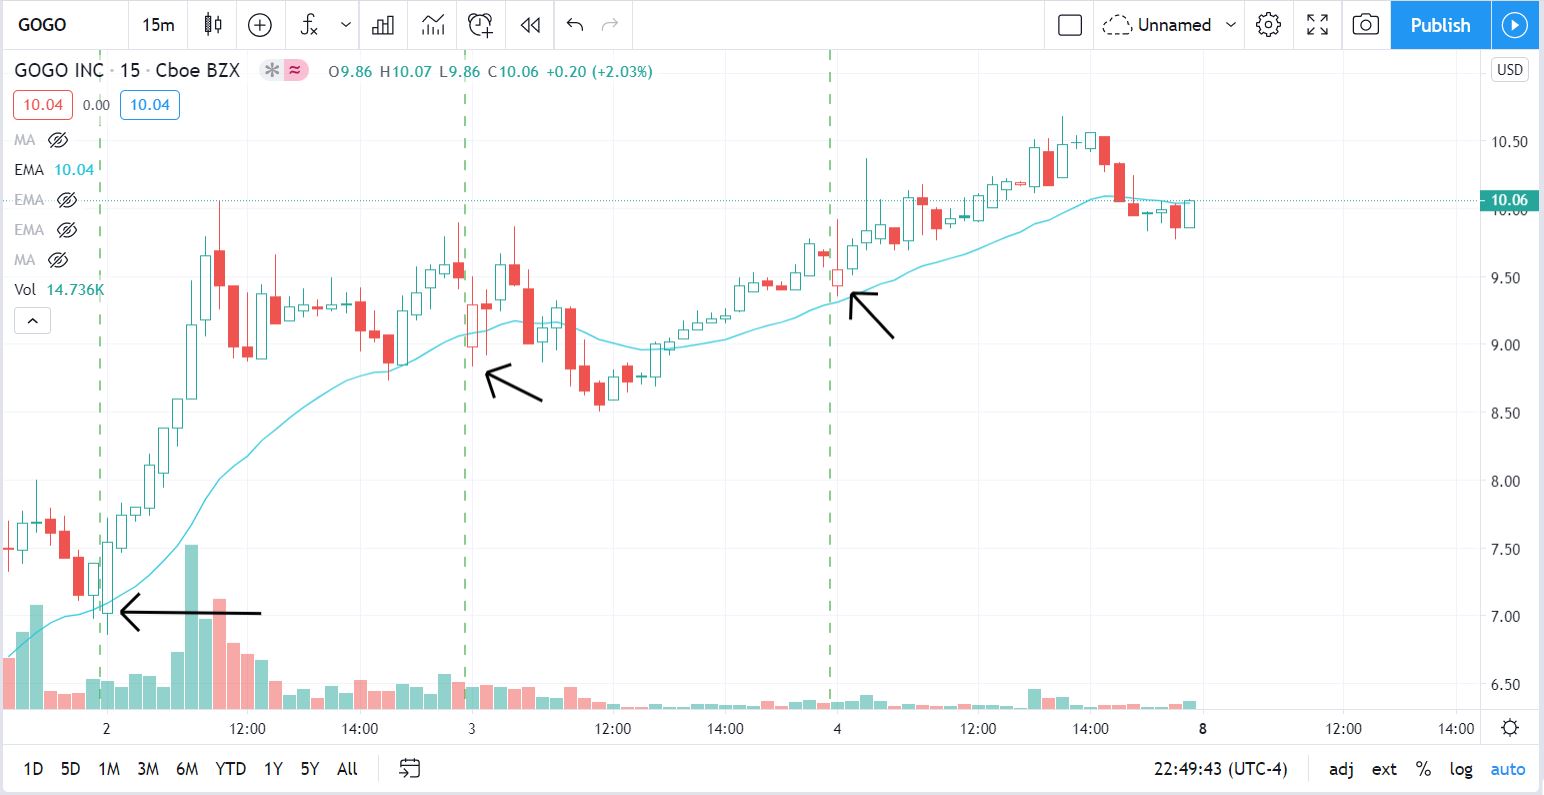
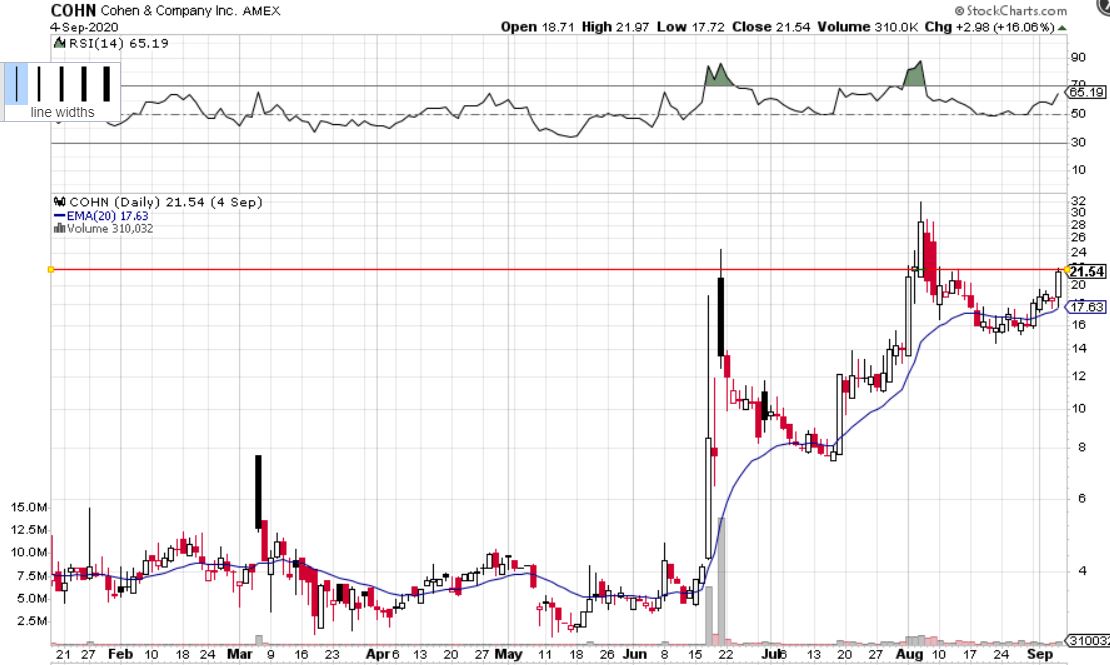
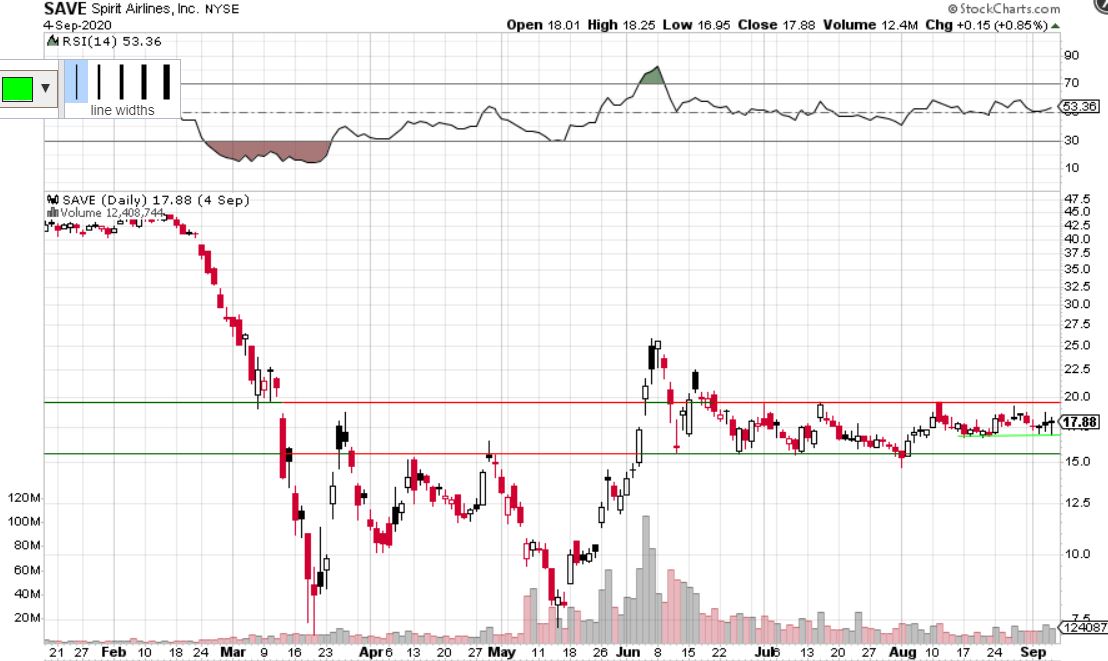
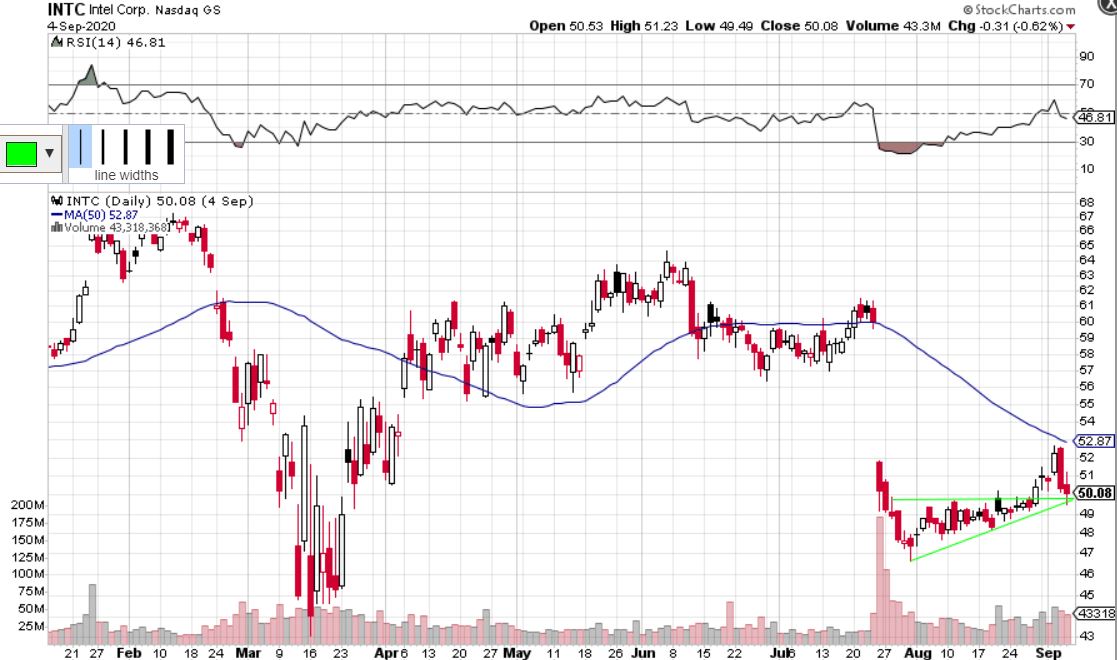
Last week was the week where we finally saw a real pull back in the market. We warned about it in our watchlist last week and on twitter as the market was getting way too ahead of itself. Now, we are mostly sitting on hands waiting for the market to pick a direction and present opportunities. Here is this week's watchlist. 1. Apple Inc. (AAPL)There's trend line and horizontal resistance around $124-125 for AAPL. Waiting for it to break $125 (and retest) for a long may be the easiest way to play it. Nonetheless, a very nice doji reversal candle last Friday after that drop. 2. Square (SQ)Square broke its bullish channel but has bounced off the 50MA so there is hope for a reversal. 20 EMA (red line) is now resistance, therefore, it has to reclaim that level around $151 to be bullish. 3. Fastly (FSLY)Head & shoulders setup, so it is bearish overall. However, this has been a strong name so it may be tricky to short. Will look for failed attempts to make new highs or for a break of ~$70 to go short. 4. Innovative Industrial Properties (IIPR)Strong bounce off of its trend line at $110. Ideally it would be nice if it held around this level for a few days or weeks in time for the trend line to catch up to the current price for a long position. Currently no position. If it breaks $110, the downside targets would be $105 and then $100. Strong support at $100 should be a buying point if price gets down there. 5. Ford Motor Co. (F)Ford has formed a cup and handle in the past 6 months that can break out to the upside any moment now. It has also formed a mini head and shoulder in the past 2 months. The best course of action could be to wait for Ford to break $7.10 (a break of the shoulder) and/or the trendline above it for an initial long position. If it starts to go under $6.65 it will be in favour of the H&S setup. $6.50 is a support level that would have to break for any significant downside. 6. Lululemon Athletica (LULU)LULU bounced off of a double trend line support. Look for it to show bottoming patterns for a long. Also, a confirmed break out of Friday's high (roughly $376.50) would be a good long entry. 7. Boeing (BA)BA has support around $163-165, nearest resistance points at $180 and $190. It's forming an inverse head & shoulders. Needs a few more sideways days to solidify $165 support level in order for a confident long position. 8. Zscaler, Inc. (ZS)Zscaler bounced off a triple support (2 trend lines and 50 SMA) so it has potential to bottom out here and go higher eventually. Same idea as LULU. Waiting for a break of Friday's high or some bottoming action before jumping the gun. 9. GOGO Inc. (GOGO)Pay attention to this chart. Notice how the stock opens (highlighted by the arrows). It usually opens just below the previous days close, will come down a slight bit, and then rip higher. Look for a "weak open" like how it has been doing, and then go long as it starts to bottom out in the morning or if it goes from red to green on the day. Intra-day examples of this BELOW using the 15 min timeframe showing the last 3 days of price action (black arrows are pointing to the first candle of that day). 10. Cohen & Company (COHN)Same idea as GOGO, a potential trade off of a "weak open". Another trade idea would be to wait a few days for bullish sideways consolidation around this price area in anticipation of a break of the ~$22 resistance level. 11. Spirit Airlines (SAVE)Similar to Boeing listed above but with more potential as the short interest for SAVE is 25.55% which is very high. Learn more about short squeezes here. SAVE was unaffected by the sell-off last week which is a good sign. It has been holding ~$17 support so stop losses should be placed a bit under, around $16.45. Low $17's seems like a good buying price and if it breaks $20 resistance, $22.50 is next. 12. Intel Corp. (INTC)INTC held a double support. No position. Looking for either a bottoming confirmation or a break of the support for a short. |
Categories
All
Archives
September 2022
|

 RSS Feed