 Here's this weeks' stock watch list. The stocks to watch are: GOOG, F, ACM, DISCA, FCX, CAT, LLY, NWS, CMLS, APOG, MSFT, NET, FB, as well as Gold and Silver. Note: If any charts are too small to see, you can click on them to see the full image. 1. Alphabet Inc. (GOOG)GOOG showed great relative strength compared to the overall market and seems to be breaking out of a horizontal resistance. Formed a base at $2000, closest resistance $2150. 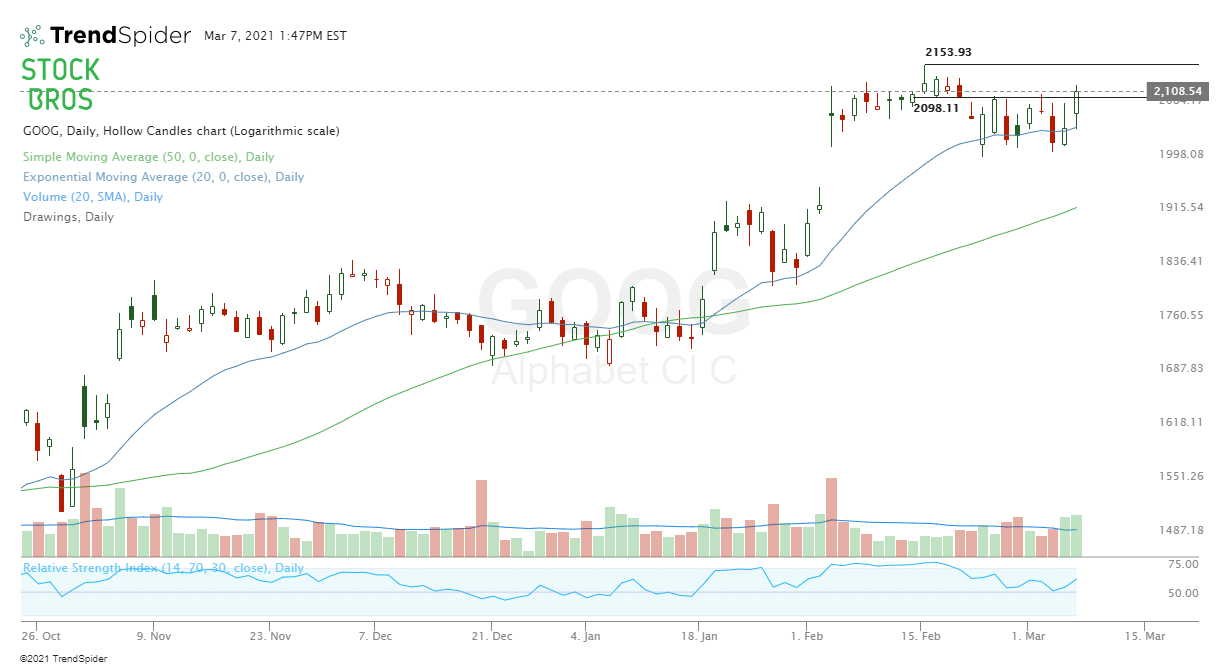 2. Ford Motor (F)Ford has a nice volume shelf under it supporting this bullish chart. Has held the 20 EMA the last few times it tried to go under. Use 20 EMA as a guideline for longs. 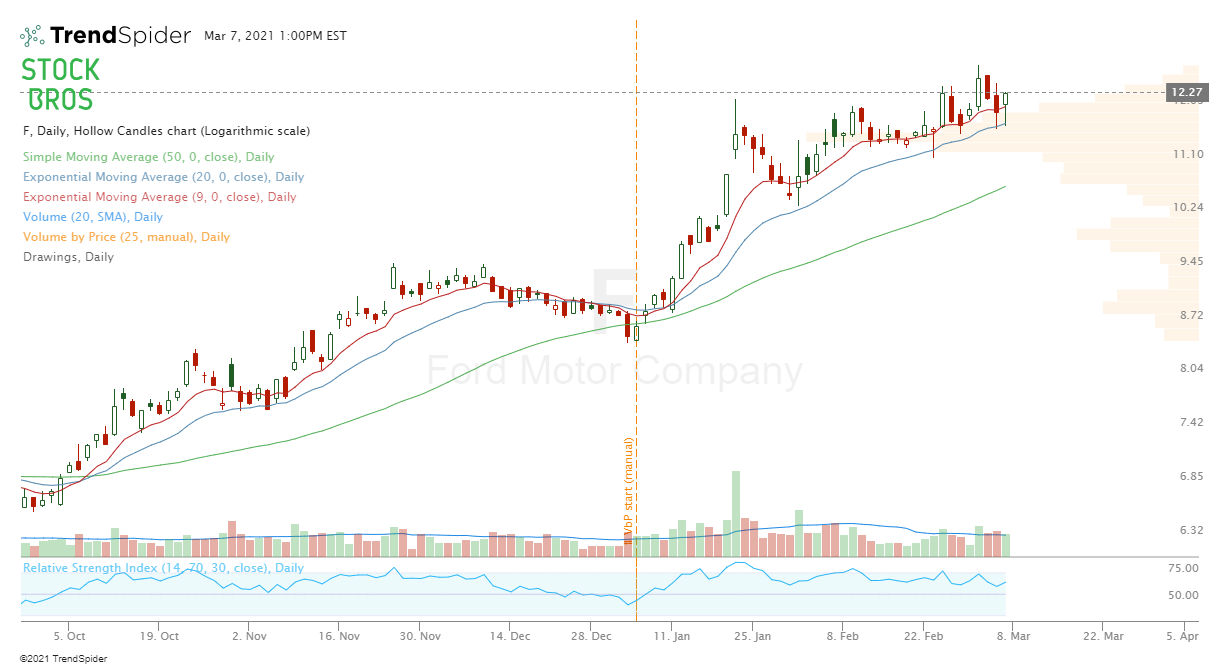 3. Aecom Technology (ACM)ACM retested a previous resistance and held it nicely. It printed a nice hammer reversal on Friday so this looks fairly bullish. Initial stop loss would be under Friday's low for a long. Expecting a retest of highs and then $65 if it breaks out. 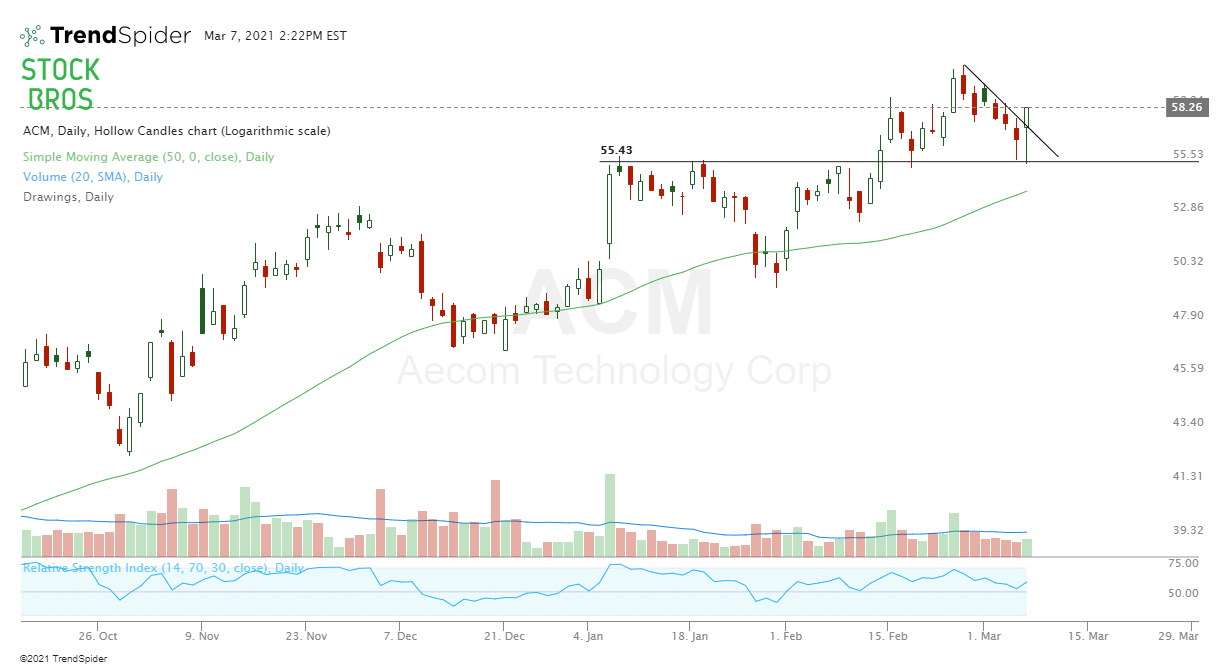 4. Discovery Inc. (DISCA)This stock is still a beast, had it on last weeks' watch list and other weeks before. Look for a dip near the 9 EMA, if it holds again like it has been, then keep going long until it breaks down. 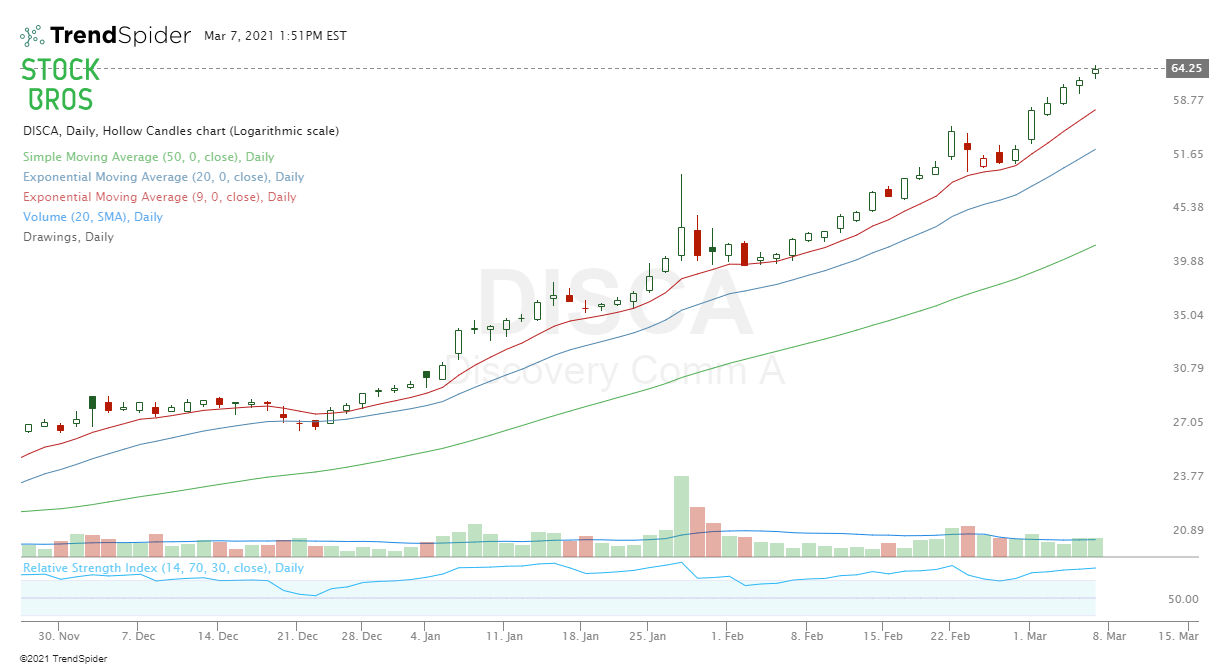 5. Freeport-Mcmoran (FCX)Pull back may or may not be done for FCX, wouldn't be interested if it pulls back under the 50 SMA, but other than that, trend is still up. On watch for a break out. 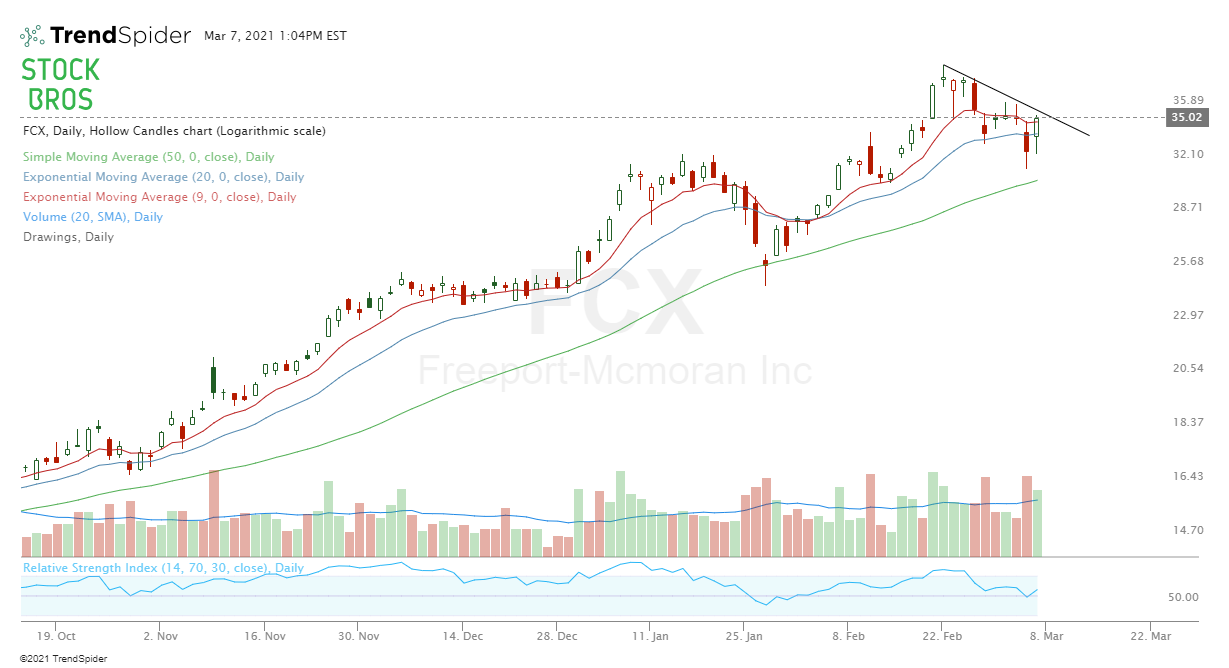 6. Caterpillar (CAT)Nice strength, break out of this short-term trend line. Looks bullish. Would use $208 as stop loss if we go long. 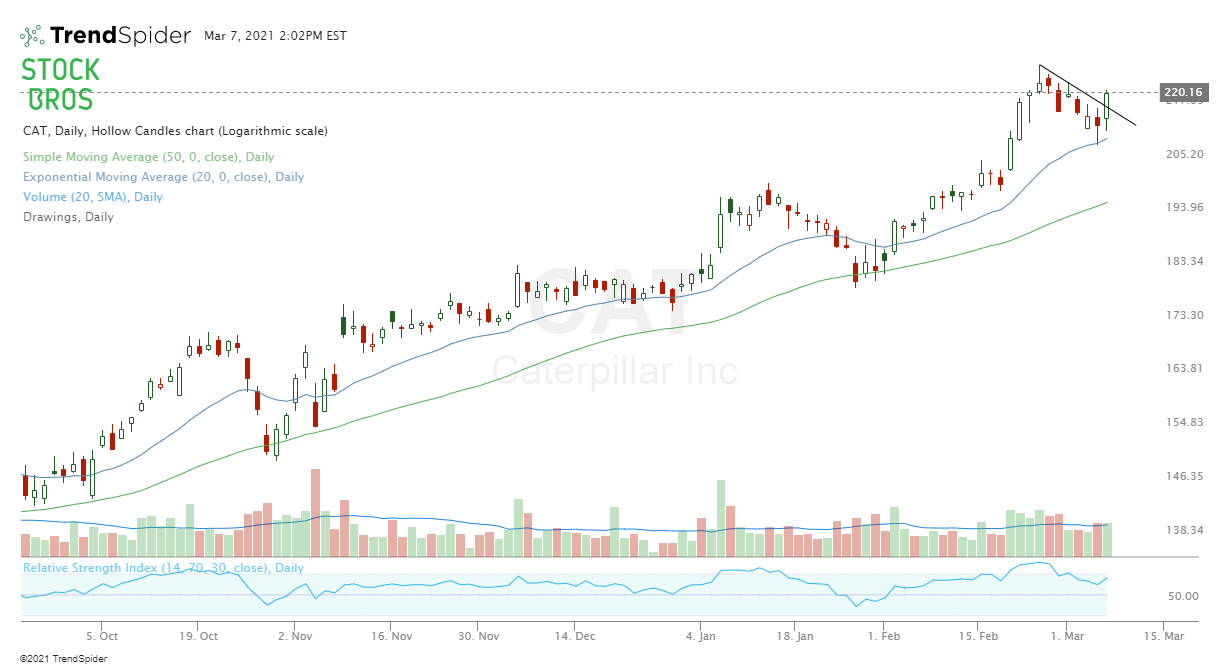 7. Eli Lilly & Co. (LLY)From last week's watch list. Nothing really happened, it's still in this range. Same idea as last week, its good to buy near the low end of the range or on a break out (we usually wait for daily candle closes or near end of day to confirm a break out). Could also be a short if it breaks down but would be hesitant to short it. 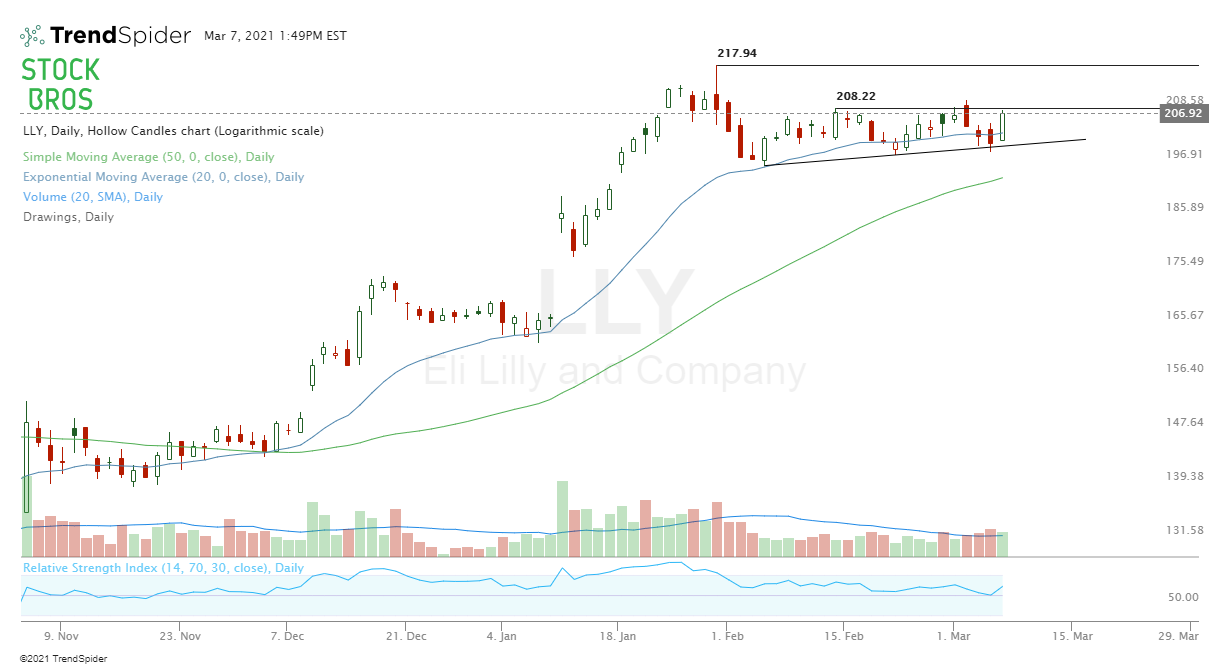 8. News Corp. (NWS)Expecting a move to the upside soon on this name, currently consolidating in this range. 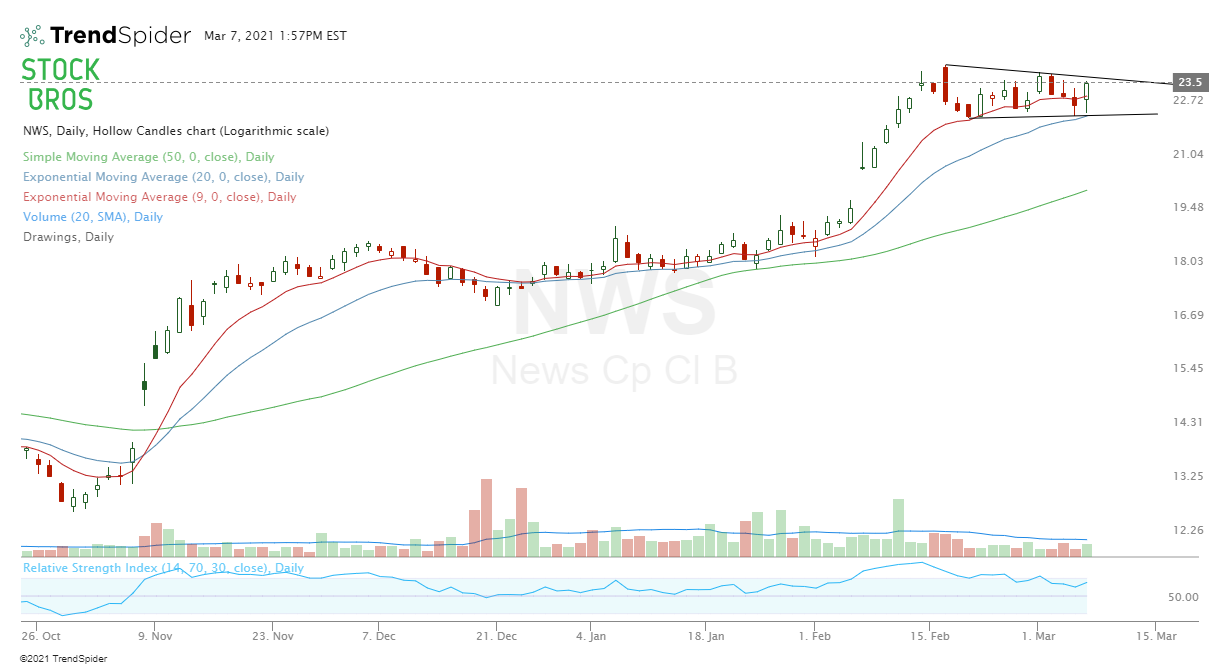 9. Cumulus Media (CMLS)Cup and handle type formation here. Look for it to keep holding around here and then make a move higher. Target for a break out would be $12 or higher. 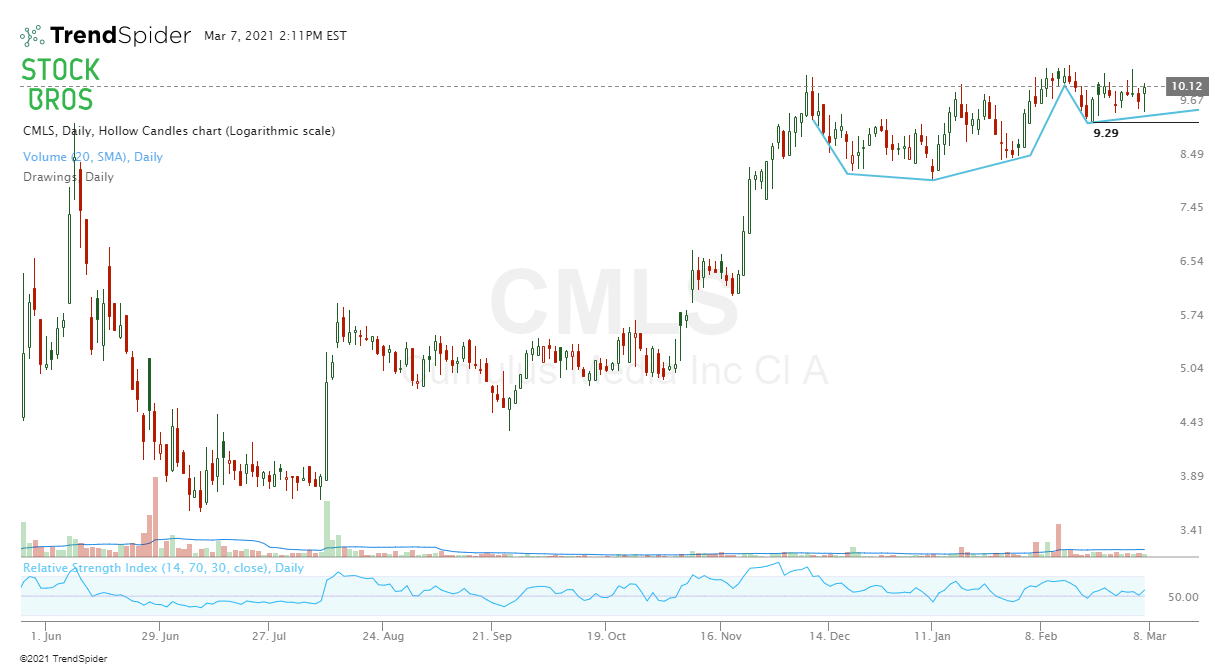 10. Apogee Enterprises (APOG)Another stock holding the 20 EMA nicely. A few more days consolidating around here could help it build more momentum for the next swing high. 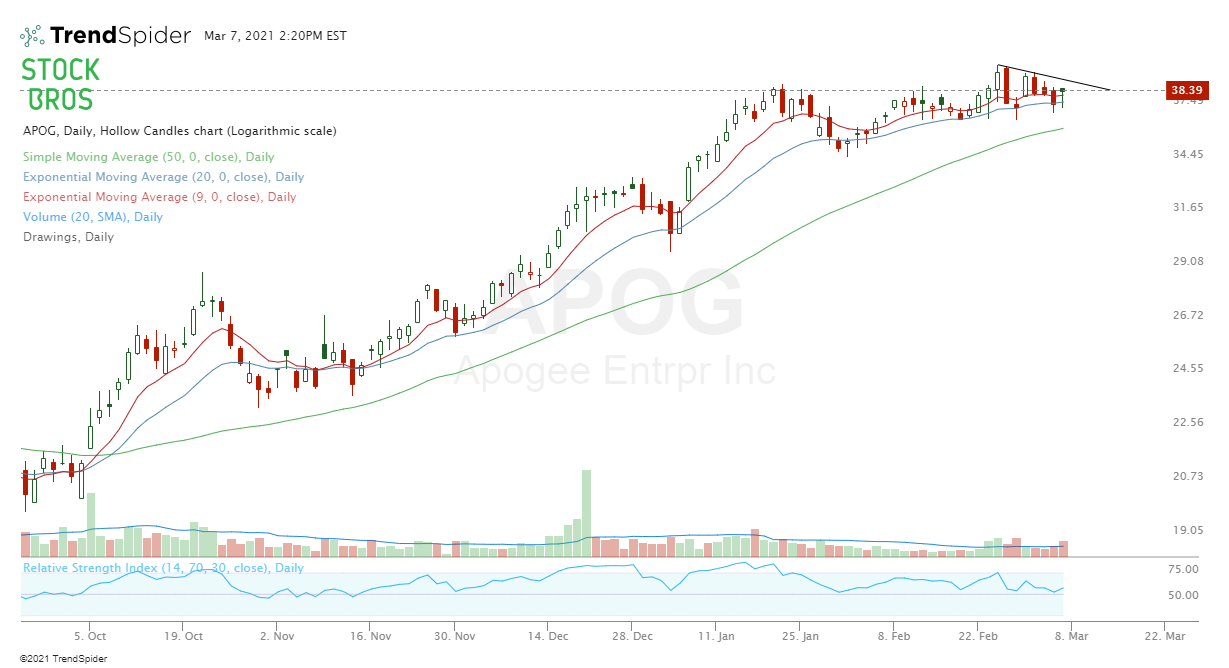 11. Microsoft (MSFT)Retest of trend line holding so far. MSFT wasn't TOO strong but also wasn't that weak last week. On the weekly time frame it bounced off the 20 EMA which is a good sign. Might need some more time but we think overall the trend is higher. 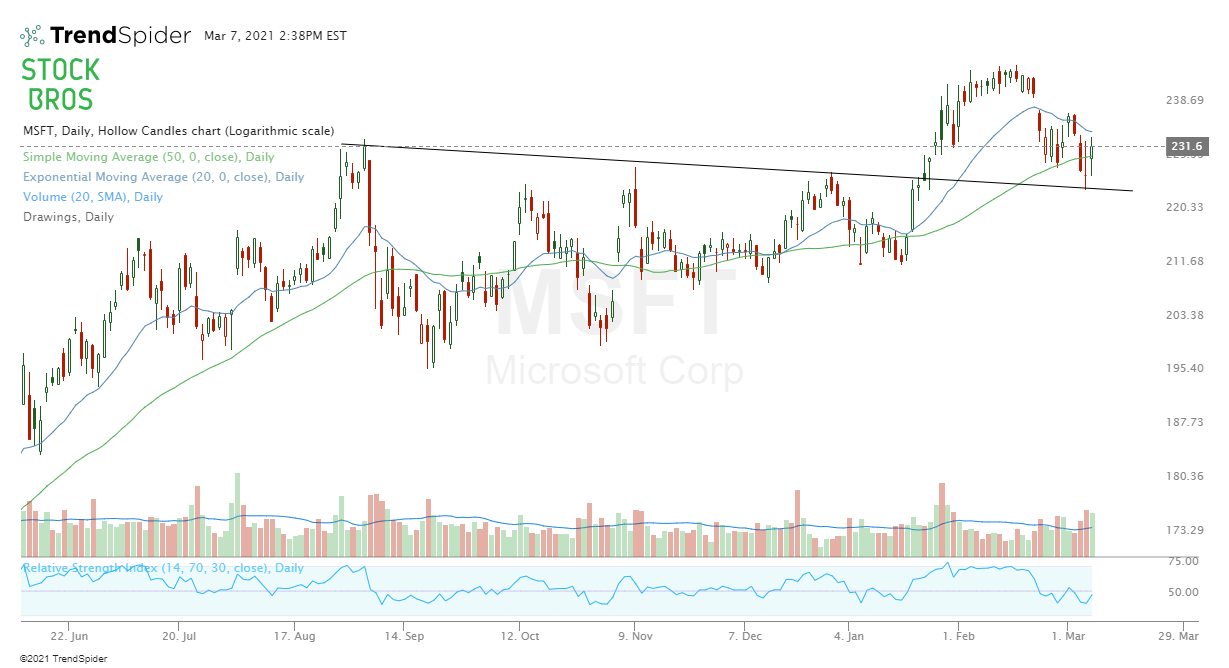 12. Cloudflare (NET)This broke down last week and we'd be interested in shorting only if it gets near the trendline and starts to show signs of weakness around there. No point in jumping the gun on shorts in this market if it just blows through the trendline. 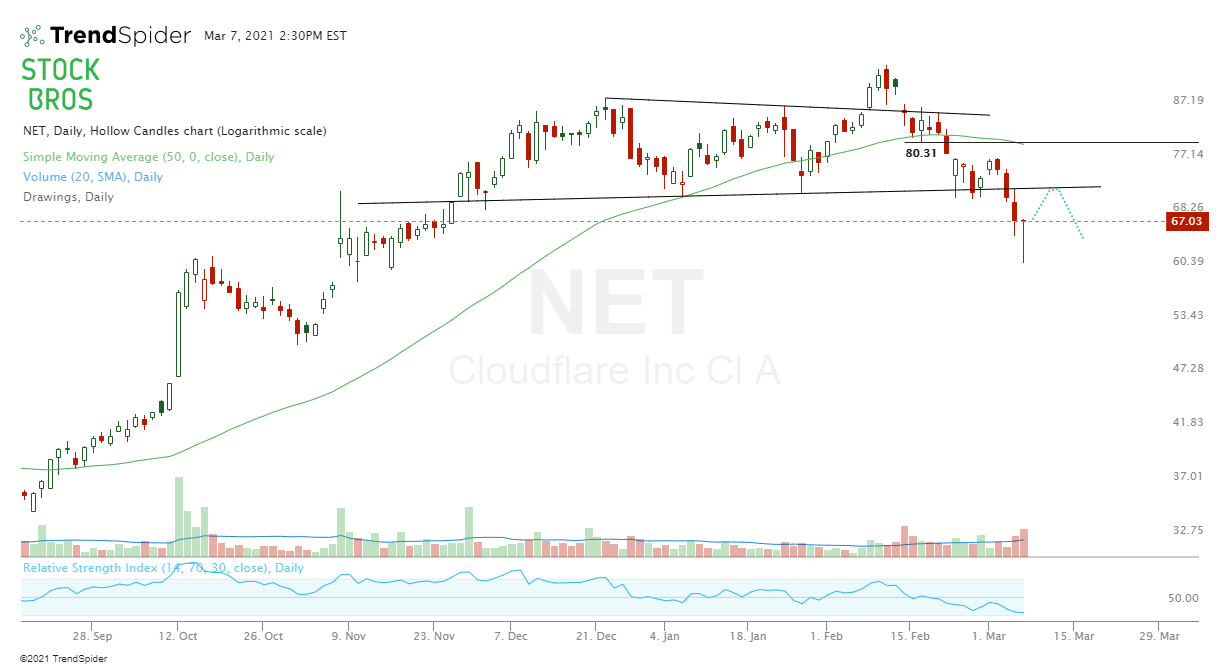 13. Facebook (FB)This worked in last weeks' watch list as it kept coming down when it got near $267. FB is currently very range bound and the easiest thing is to just play the range. If it does break out though the target is $275 and a break down target is $245. 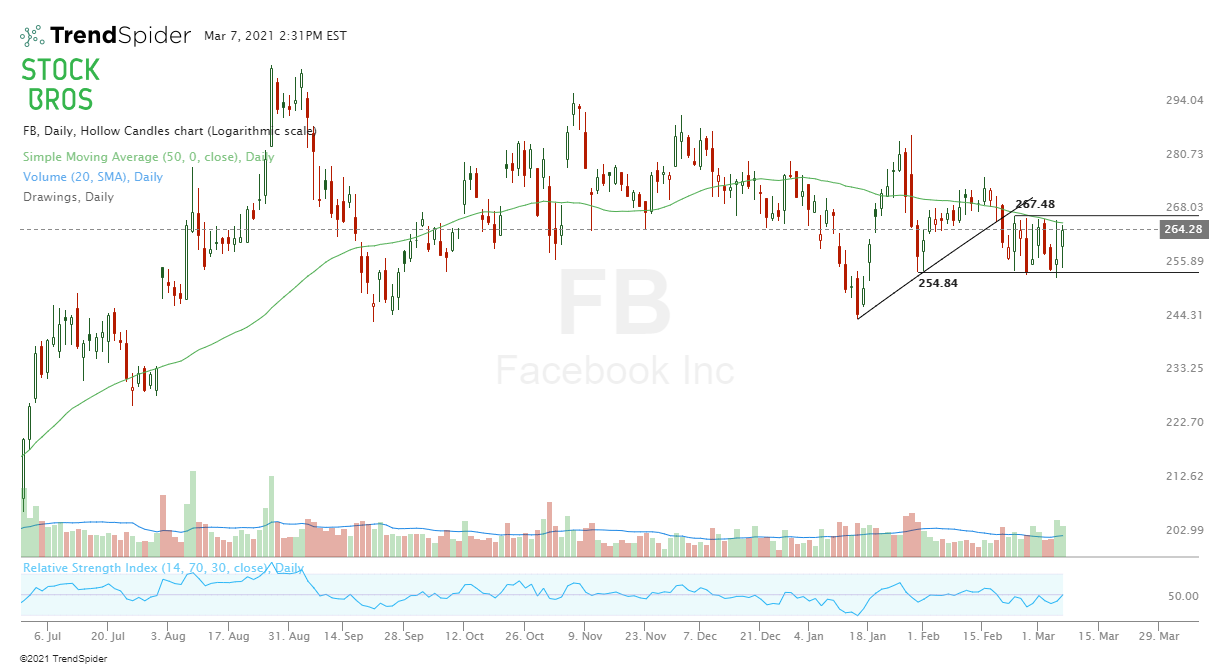 14. Gold (XAUUSD or GLD)We've been fairly bearish on gold the past few months for the most part but now it looks like it could be due for a bounce. It's near horizontal and trendline support so it'll be interesting to see what happens here. 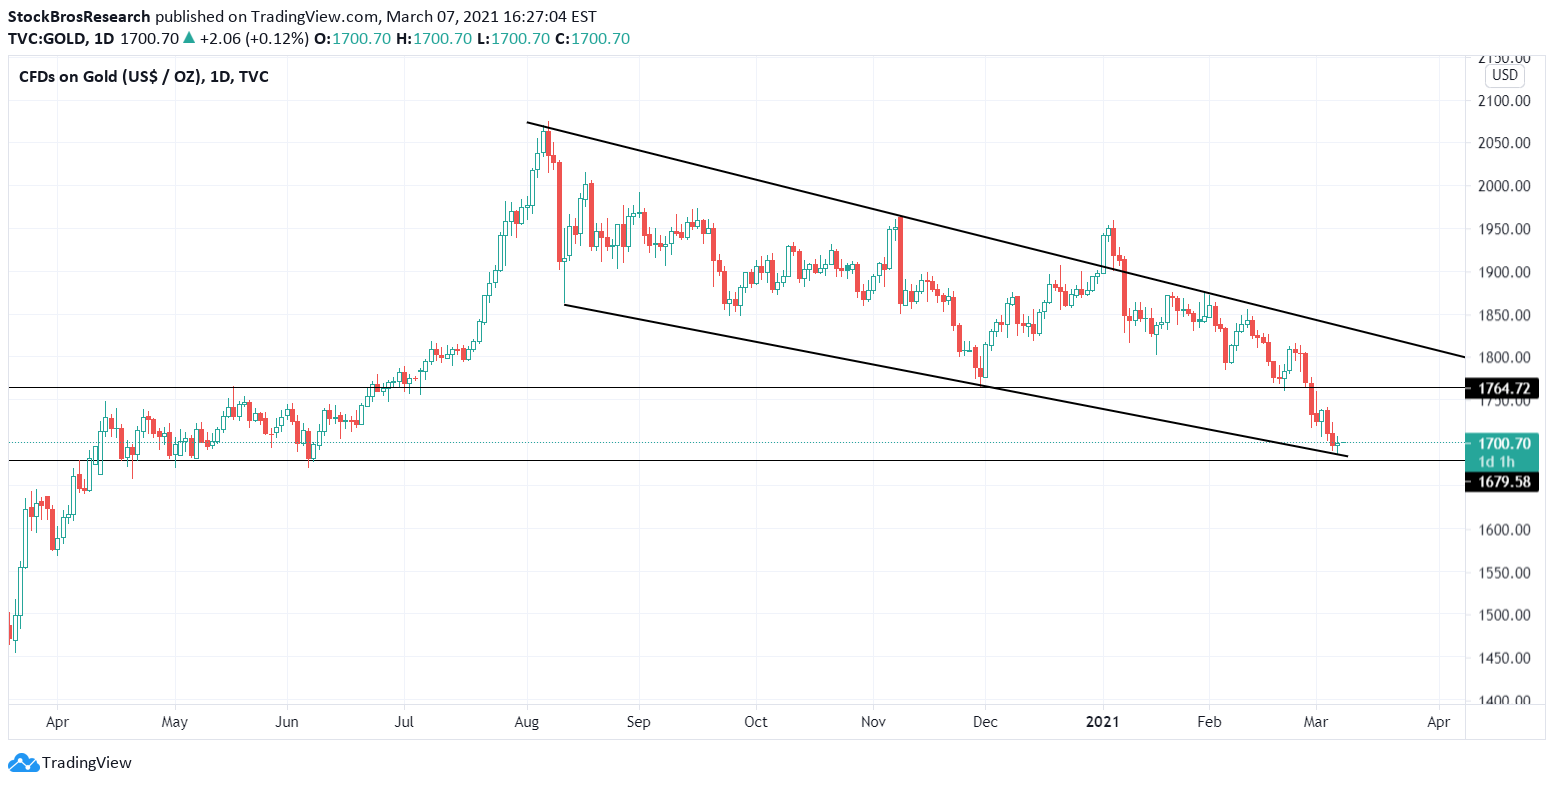 15. Silver (XAGUSD or SLV)Silver is retesting a level that has been hit many times before. We think the odds are that it respects this general support area and bounces higher. 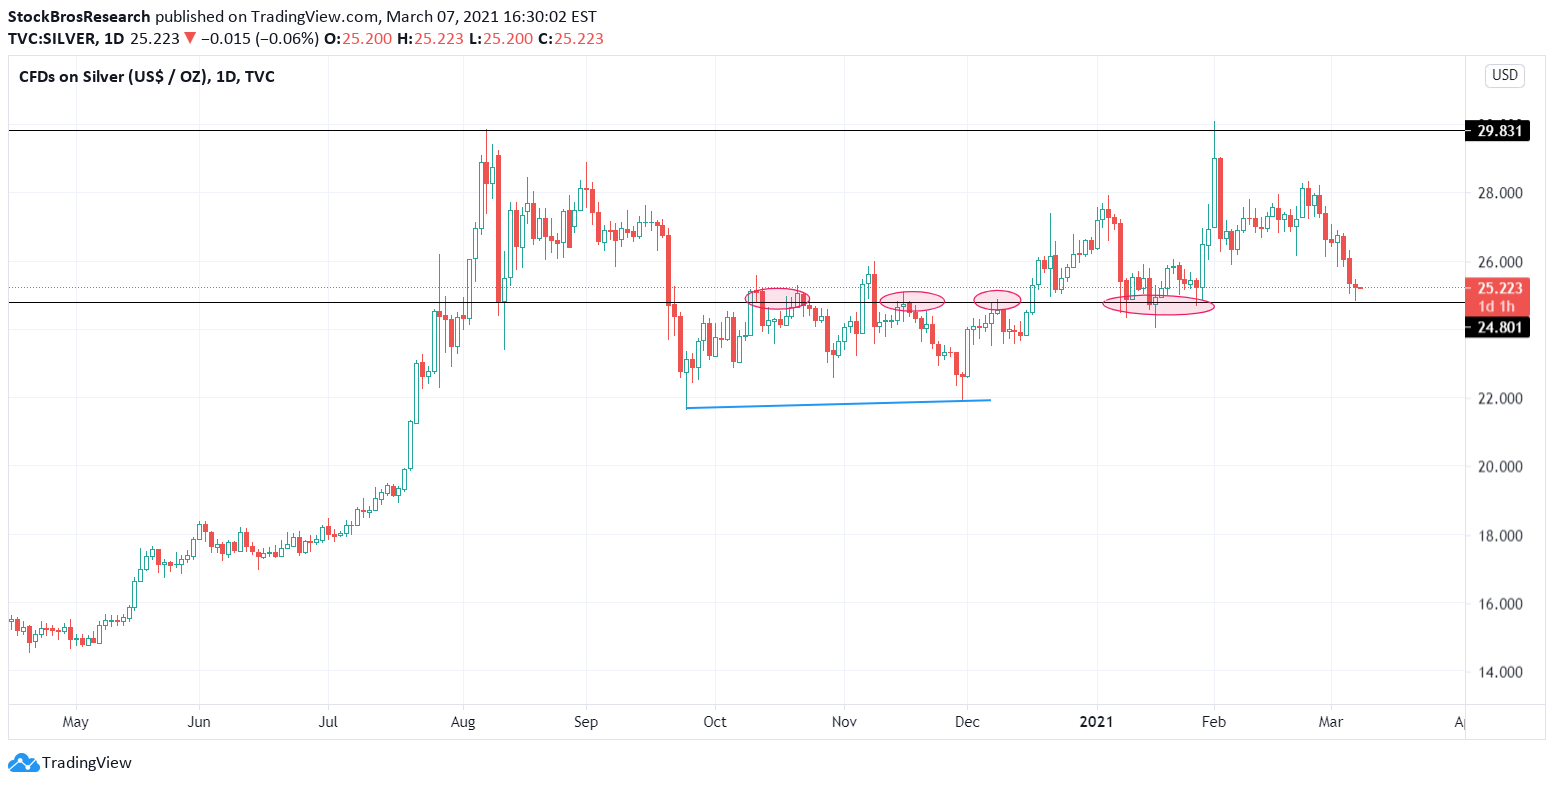 Need Chart Software?TrendSpider is a top-tier charting platform where traders can put their technical analysis skills to work. It offers automated technical analysis tools, dynamic price alerts, back testing, 1-on-1 training sessions for those who need extra help, and more. A very unique tool that TrendSpider has is Raindrop Charts, which can give you a great edge with your trading.  Get 10% off TrendSpider plans by clicking here & using the coupon code TS10 when signing up. Related Category Related Articles
Thanks for reading! If you enjoyed this article, please consider following us on twitter @StockBrosTrades and/or subscribing to our free newsletter to get articles like this sent to you when they are posted! Shop Stonks Here |
 Categories
All
Archives
September 2022
|


 RSS Feed