 The Relative Strength Index (RSI) indicator is one of the most popular and basic indicators out there. Most traders know about the RSI. However, does it really work? Spoiler: it can be profitable, but it’s probably not the best indicator out there. What is the Relative Strength Index Indicator?The RSI measures if a stock is “overbought” or “oversold.” The indicator ranges from 0-100, and a rating under 30 signals that a stock is oversold whereas a rating over 70 signals overbought conditions. The default RSI settings measure a stock’s relative strength over a 14-day trading period, although this can be changed to any period. Generally, traders like to think that buying an oversold stock is a good idea because it will bounce higher in the short term. Similarly, they’d sell overbought stocks thinking that they return to the mean. Here’s what it looks like (the blue area at the bottom of the chart). Right now, the S&P 500 is almost at oversold levels. Should you be gearing up to buy? 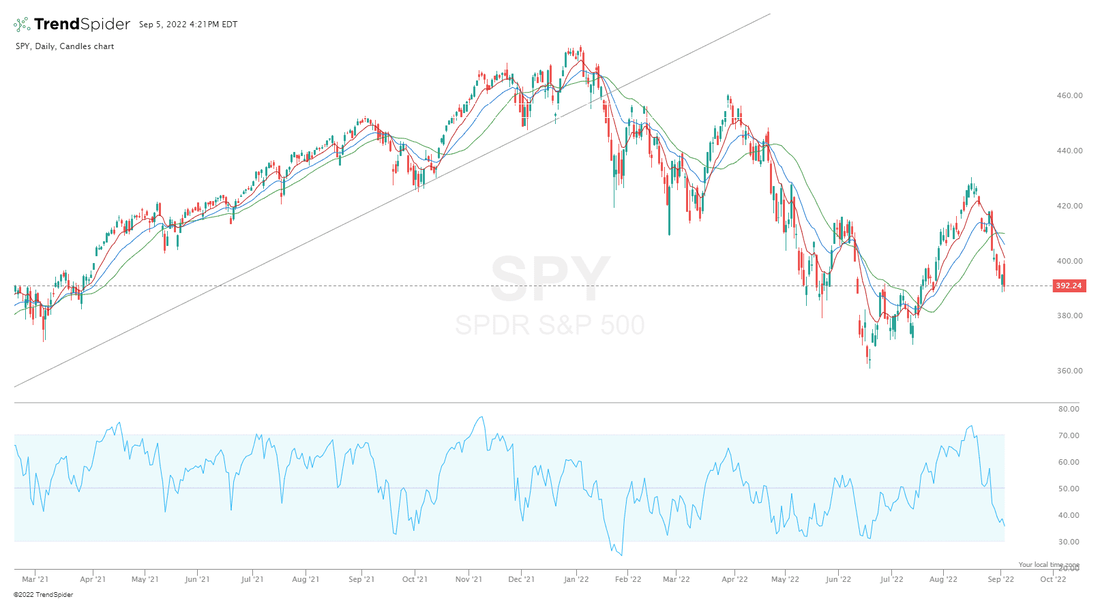 How We’ll Backtest Our ResultsTo backtest our results, we’ll be using TrendSpider’s backtesting tool. To get more information about how this works, you can check out our How to Backtest article here. TrendSpider is a great software platform that gives you access to highly-customizable charts, backtesting software (no coding required), trading alerts, trading bots, and much more. In fact, with its trading bots, you can create your own strategy and make it trade for you automatically on your brokerage! You can check out TrendSpider here and get 25% off if you use our special discount code “SBR25.” You can also get a 7-day free trial, so there’s no risk if you don’t like it. Backtesting the RSI IndicatorStrategy #1: Buying when the RSI reaches 30 or lower, selling when it reaches 70 or higher: Ticker: SPY — Timeframe: Daily The strategy tested below simply only bought the SPY when its RSI reached 30 and only sold after it got to 70. As you can see below, it was profitable over a 27-year period, but it wasn’t all that great. It caught a max drawdown of over 60%, as it did horribly in the 2008-09 recession. Also, it had an average loss of 21% and only returned 146% vs 615.58% for buying and holding the SPY. The goal of trading is to minimize risk and maximize profits. This strategy didn’t seem to do that. 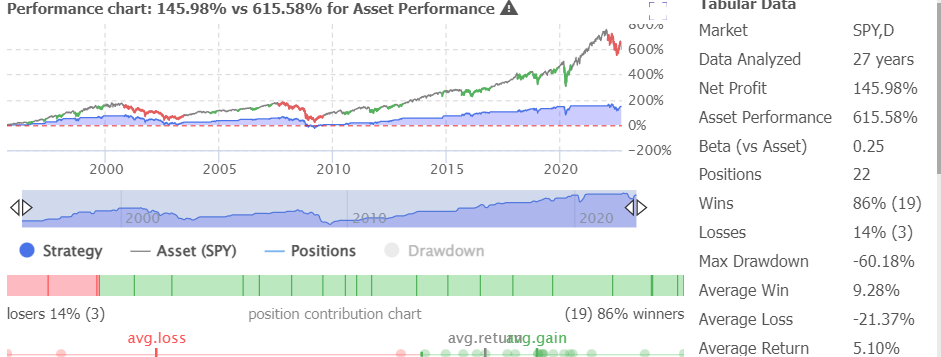 Now, let’s try the same strategy from above but on the 65-minute timeframe. This one performed slightly better overall and had less drawdown. However, it still isn’t ideal and doesn’t seem worth pursuing. 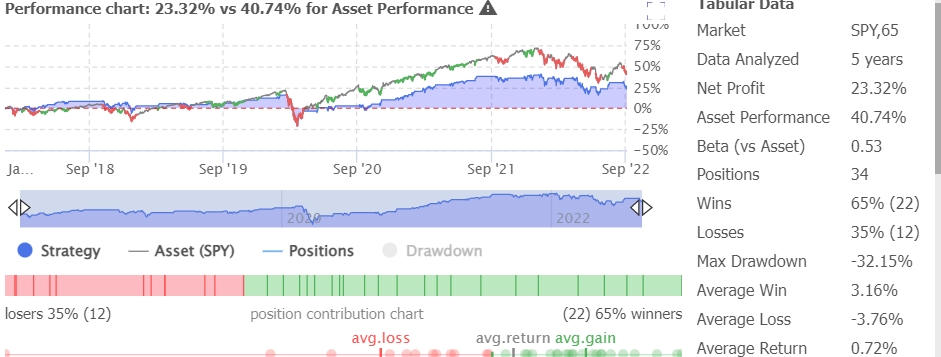 Other timeframes using the same strategy weren’t that impressive either. So, let’s change it up a bit by adding one extra exit condition. Strategy #2: Buying when the RSI reaches 30 or lower, selling when it reaches 70 or higher, OR automatically selling after 5 candle closes Ticker: SPY — Timeframe: Daily The strategy below is the same as the strategy above except it will automatically sell the position after 5 candles have passed in the specified timeframe. This helps reduce drawdown and follows the idea that a stock should bounce relatively quickly after being oversold. As you can see, the max drawdown was reduced to only 18.8%, but overall, the strategy still isn’t impressive. The overall returns are also low, at 48.5% over a 27-year period. 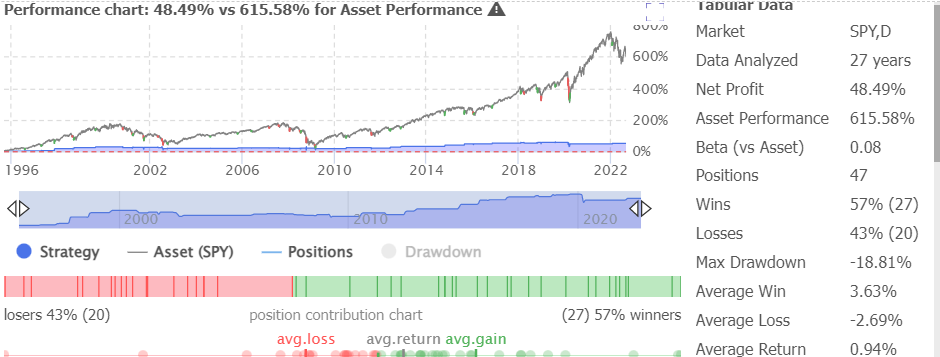 The same strategy on the 65-minute timeframe was no good and not worth showing. The 30-minute timeframe (shown below) is more impressive from a risk-reward standpoint, but it’s still nothing special. It may act as a decent low-volatility strategy at best, as its max drawdown was only 8% over the past two years. 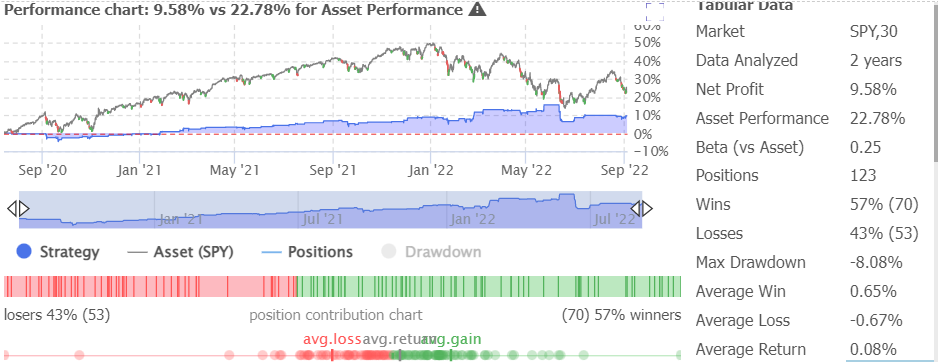 Let’s add another variation to the original strategy to see if it works better that way. Strategy #3: Buying when the RSI reaches 30 or lower, selling when it reaches 70 or higher OR selling after a 2% gain: Ticker: SPY — Timeframe: Daily The strategy shown below is the same as the first one, except it also sells when your trade hits a 2% gain. This ensures that you’re taking profits when given them. While it had a staggering 100% success rate and decent performance, it’s still a bit of a risky strategy since it doesn’t have a true risk-minimizing exit condition. It was completely unable to avoid the 2020 crash, which is where it saw the -27% drawdown. Overall, not the best, but it still did better than the original strategy that didn’t include the 2% take-profit exit condition. 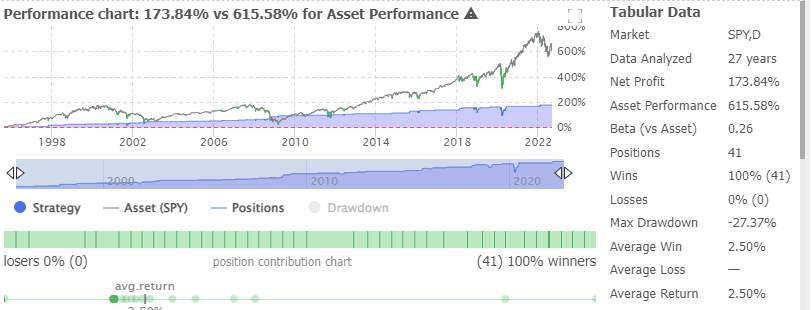 Shorting Using the RSI Indicator Strategy #4: Shorting SPY when RSI crosses over 70, covering the short either after a 2% gain or after 5 candle closes Ticker: SPY — Timeframe: Daily As expected, shorting an uptrending SPY chart using a simple RSI indicator didn’t really work out. The net loss was 11.3%. The 65-minute and 30-minute timeframes had negative results as well, but at least the max drawdown of 14.9% wasn’t horrible. 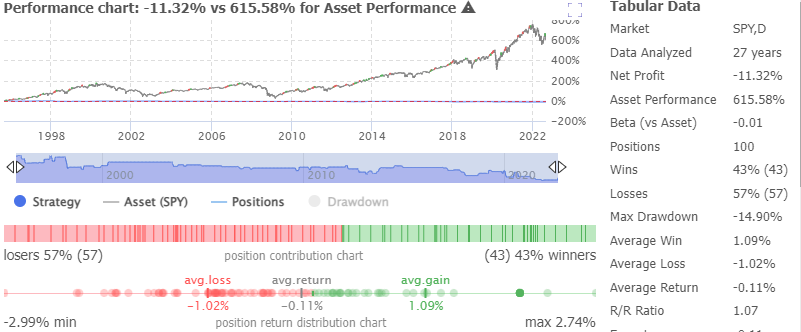 However, if you change it to shorting after the SPY hit 75 RSI instead of 70, the results are slightly better. Strategy #5: Shorting SPY when RSI crosses over 75, covering the short either after a 2% gain or after 5 candle closes Ticker: SPY — Timeframe: Daily When using 75 RSI as the overbought level to short SPY, the strategy actually has a positive return despite shorting into uptrends. Also, the max drawdown of 6% is surprisingly low. Therefore, a strategy of this nature may be worth looking into. If you don’t like shorting, you could use this as your take-profit strategy for long positions (take profit over 75 RSI). 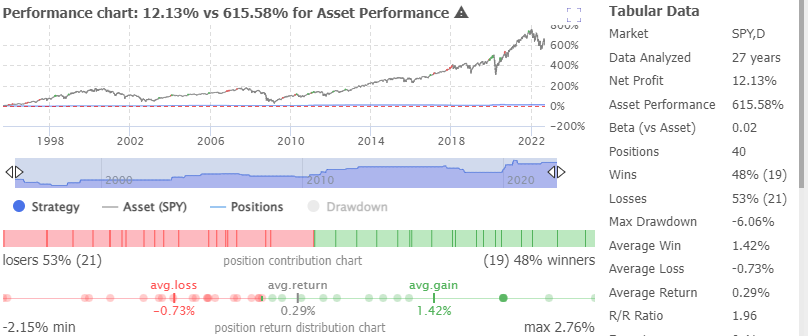 Using the 65-minute time frame for the same strategy also had positive results. Nonetheless, neither of these results are that impressive except for the very minimal drawdown. 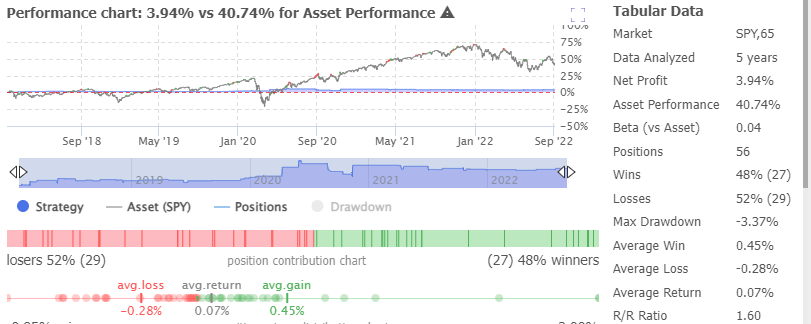 You may be wondering, if 75 RSI was an improvement over 70 RSI, then 80 RSI would be even better, right? Well, not really. Here’s an example: Strategy #6: Shorting SPY when RSI crosses over 80, covering the short either after a 2% gain or after 5 candle closes: Ticker: SPY — Timeframe: Daily Compared to using the 75 RSI, the net gain got smaller, and so did the max drawdown. So, it balances out. Also, there were only 10 trades taken in 27 years, and it’s not really enough data to make a conclusion out of it. Also, the 65-minute time frame saw slightly negative results using this strategy and the 30-minute time frame was about flat. Not worth pursuing. 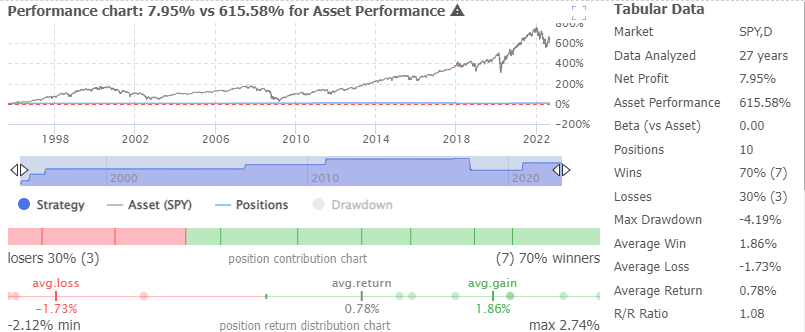 Conclusion: Using the RSI Indicator by Itself Isn’t the Best IdeaAs the heading states, the RSI indicator isn’t exactly the greatest when used by itself. At least that’s what the backtest results showed. However, there is some hope for the RSI if you can combine it with other indicators or find other ways of using it that yield better results. After all, that’s what backtests are for, you can check it all out for yourself to see what works for you. Please note: Past performance is not indicative of future results, backtests are for informational purposes only. Just because a strategy worked well in the past, doesn't mean it will work well now. Keep this in mind when testing a trading strategy. Read: How to Backtest a Stock Trading Strategy - No Coding Required Read: Shorting Growth Stocks - Backtesting a Moving Average Strategy on ARKK Thanks for reading. Hope you found this article helpful!  |
 Categories
All
Archives
September 2022
|
 RSS Feed