 Have you ever thought of a stock trading strategy that could be profitable but you didn't want to waste the time or money to find out by actually trading it? Well, that's what backtesting is for, and no, you don't need to know how to code a strategy in order to backtest. Backtesting is easy and this post will show you how to do it. We'll even show the results of a simple MACD crossover strategy. How to Backtest Your Trading StrategyIn case you are unaware, backtesting is simply testing a certain set of criteria using historical data. Without wasting any more time, let's get right into it. We use TrendSpider "strategy tester" for backtesting, it's simple to use and provides useful data for backtests. There are other sites out there, but we'll talk more about them later on this post. TrendSpider is a charting platform that also offers backtesting and many other features. You can use premade entry and exit strategies, or you can create your own either from scratch or by editing premade strategies. Below is an example of what a simple default entry criteria looks like, the "MACD cross up". It simply goes long when the fast MACD line crosses above the slow MACD on the daily time frame. 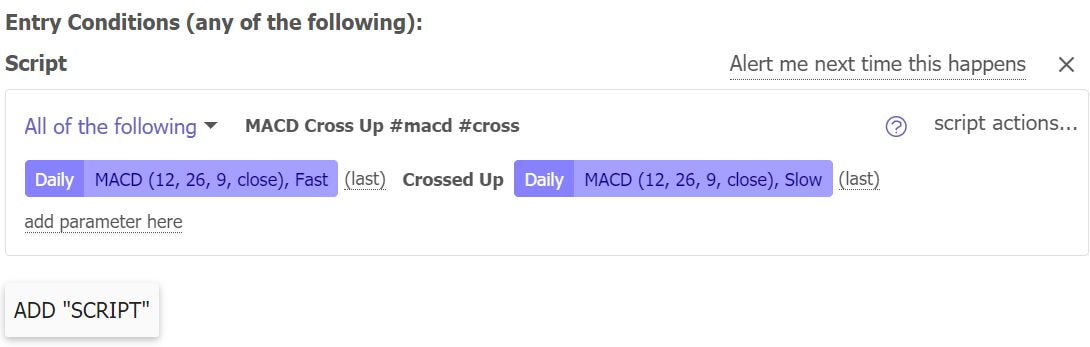 Here are simple exit conditions that will close your long position based on the MACD crossing down. Remember, this is almost as simple as it can get, but you can add all sorts of criteria and test it on any ticker of your choice. 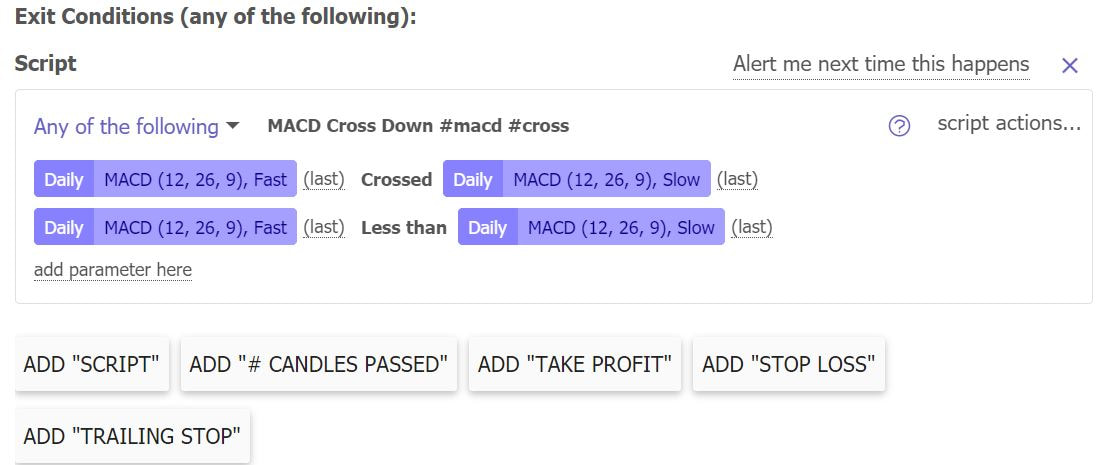 To test your strategy, all you have to do after that is click the green "TEST" button, which we placed a snippet of what it looks like. You can also choose your time frame, the types of charts it tests on (heiken ashi, regular OHLC, raindrops, line charts etc.), your preferred time frame, the amount of data to backtest, and more. See below:  Simple MACD strategy vs. the S&P 500 (SPY)After you test your strategy, the results will populate as you can see below. You get to see your performance vs. your chosen ticker, which in this case is the SPY, and you can see many other metrics such as win and loss %, averages return, beta, and more. In this case, the simple MACD strategy underperformed the SPY over this time period, returning around 118% vs about 277% for buying and holding the SPY. However, the MACD strategy also had less than half the volatility. 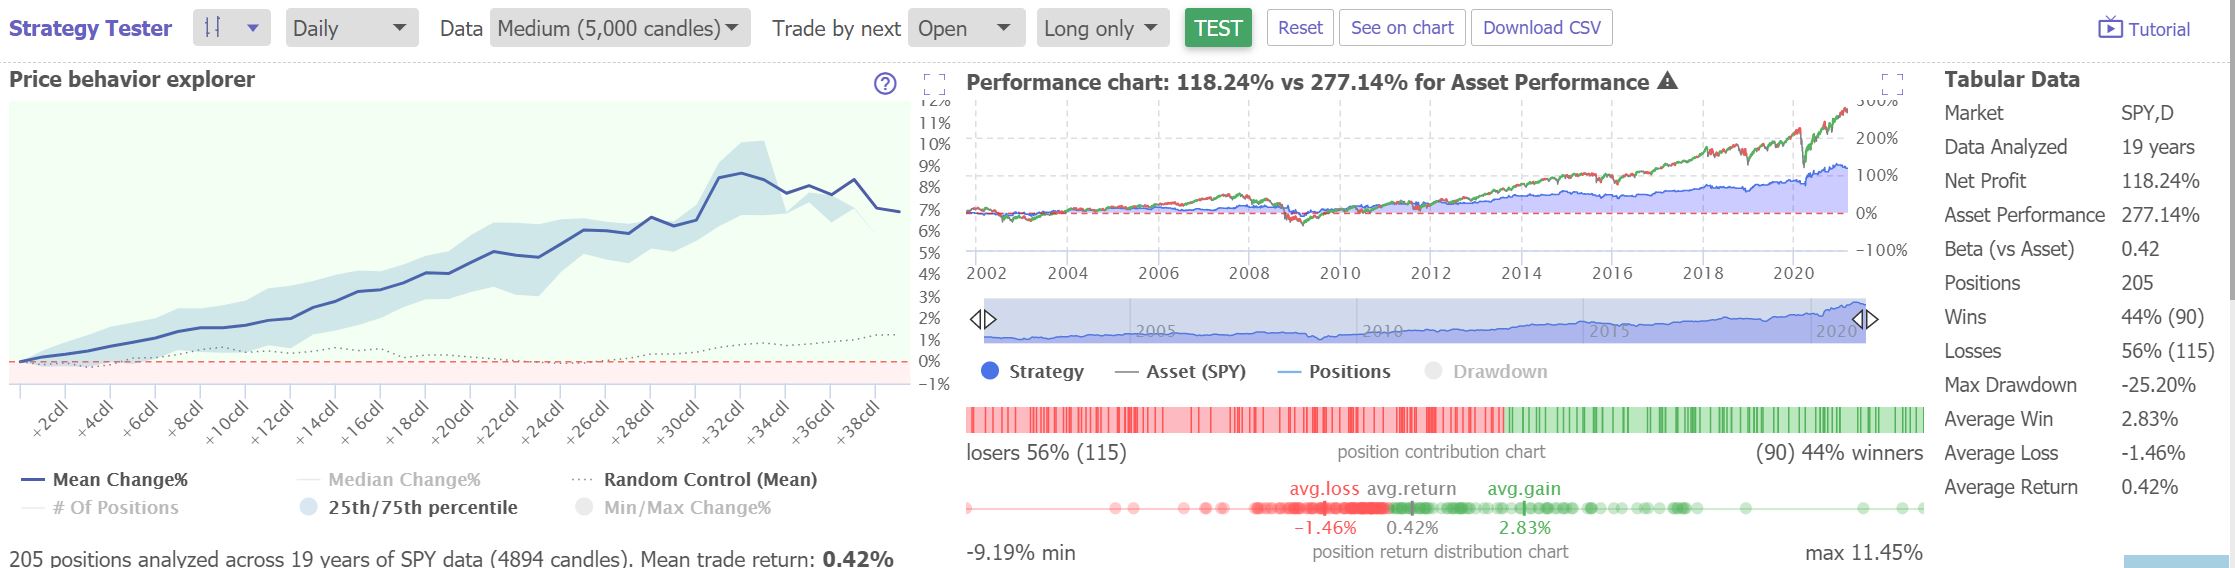 Here is an enlarged version of the returns using this strategy (the blue/purple being the strategy). 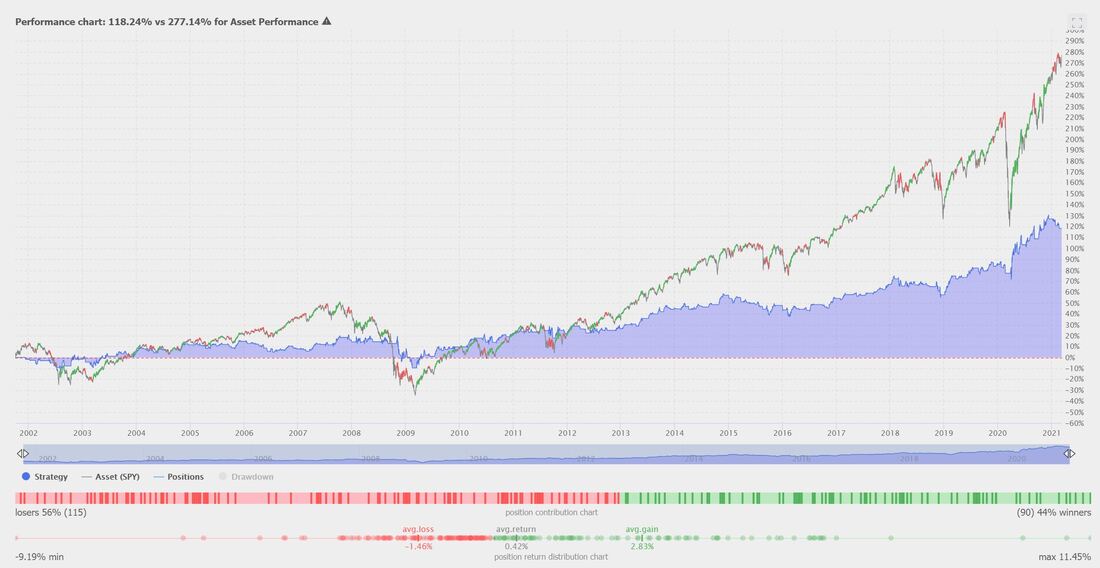 If you want, you can also make it show each entry and exit on the chart, like we did below (if the picture is too small you can click on it to see the full chart). If you look closely, you'll see that each entry and exit corresponds with a crossover in the MACD indicator. 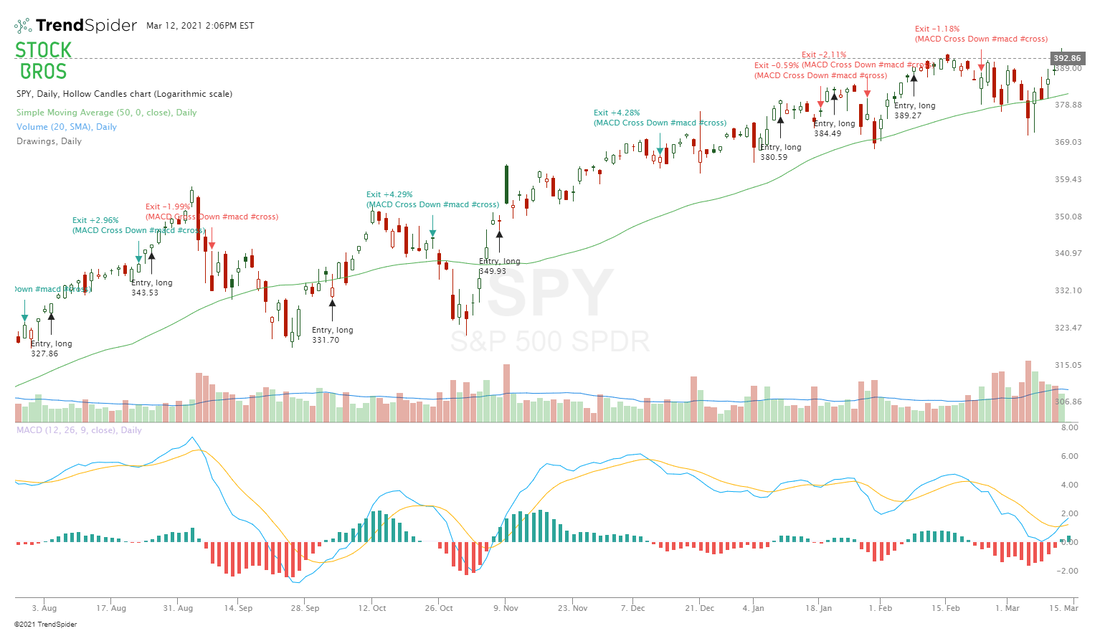 Simple MACD strategy vs Plug Power Stock (PLUG)Just for fun, we wanted to find a stock that the simple MACD strategy worked very well on. It did great with PLUG. The strategy returned 1062% in the selected period vs -53% for PLUG. It's cool to know that even a basic MACD strategy can potentially make you some money. 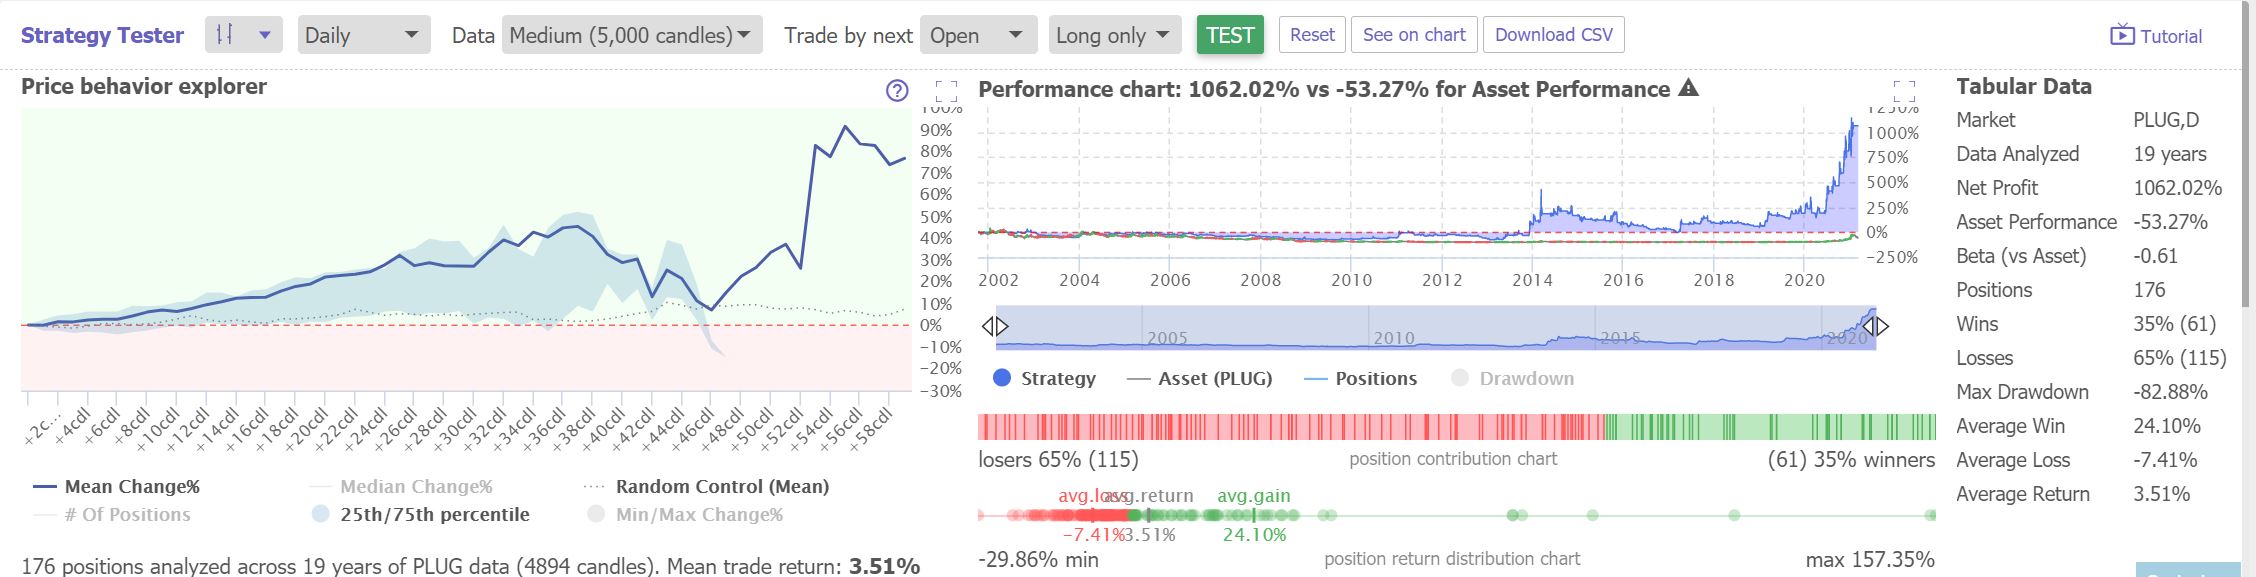 Make Your Criteria as Complex as You WantHere's an example of a more complex entry criteria (relative to the MACD strategy) that uses RSI, Williams %R, Vortex, and more, paired with a simple 0.5% trailing stop exit condition. 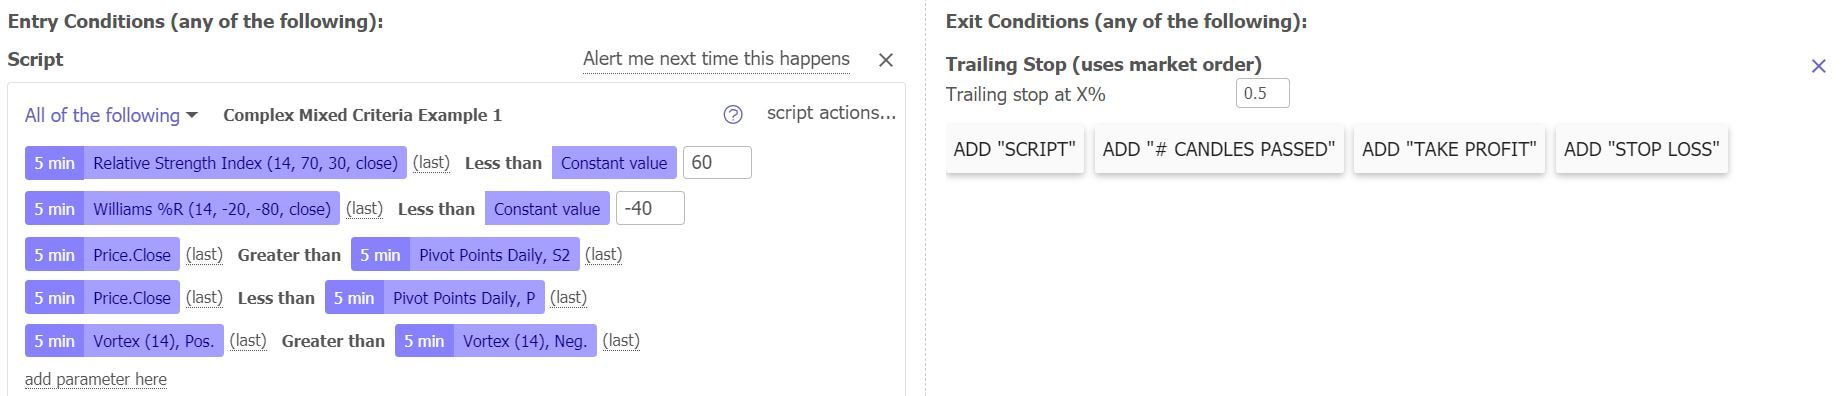 Get creative with your criteria and maybe you'll be able to find the "holy grail" or "secret sauce" that can help you beat the market with ease. Unfortunately, Good Backtesting Won't Be FreeThere are a few free websites out there that offer backtesting without coding (such as stockbacktest.com), however, these free sites usually don't have much to offer in terms of strategies/indicators. For example, stockbacktest.com only offers 7 indicators to choose from. Unfortunately, if you want access to good stock backtesting that doesn't require coding, it probably won't be free. TradingView has free backtesting, but you need to know how to code in order to test your own strategy, so that's not an option either. The good news is, if you pay for platforms that have backtesting, it's not all that expensive. You can have access to backtesting, as well as dozens of other features on TrendSpider for $65 USD a month (as of March 2021). You can get 10% off though by clicking here and using TS10 as the coupon code. Considering you're paying for other things since TrendSpider is more than just a backtester (it offers charting, automated technical analysis tools, dynamic price alerts, unique indicators, and more), it is a good price for serious traders. There's also Finviz, which has a good backtesting platform and is $24.96 a month, however, it has less options to chose from compared to TrendSpider. Nonetheless, its still very customizable and is easy to use as well. Please note: Past performance is not indicative of future results, backtests are for informational purposes only. Just because a strategy worked well in the past, doesn't mean it will work well now. Keep this in mind when testing a trading strategy. Get 10% off TrendSpider plans by clicking here & using the coupon code TS10 when signing up.  An Investing Strategy That Has Been Proven to Work Based on BacktestsPerhaps you prefer fundamental analysis and investing. Here's an article we wrote about an investing strategy that has been proven to work over several decades. Read: How to Beat the Market With Founder-Led Stocks Related Category Related Articles
Thanks for reading! If you enjoyed this article, please consider following us on twitter @StockBrosTrades and/or subscribing to our free newsletter to get articles like this sent to you when they are posted!
|
 Categories
All
Archives
September 2022
|


 RSS Feed