 Here's this week's list of stocks to watch as well as some market analysis to help you trade this week. Let's Start With Some Overall Market Analysis:S&P 500 Daily Chart: The S&P 500 wicked off a support line on Friday near 3293 but it closed below its 50 day MA for the first time since the crash. We would like to see it hold that level as the next support level under that is around 3230. On the daily chart, the closest major resistance is around 3390. If you zoom into the 4H time frame, you will see more levels. 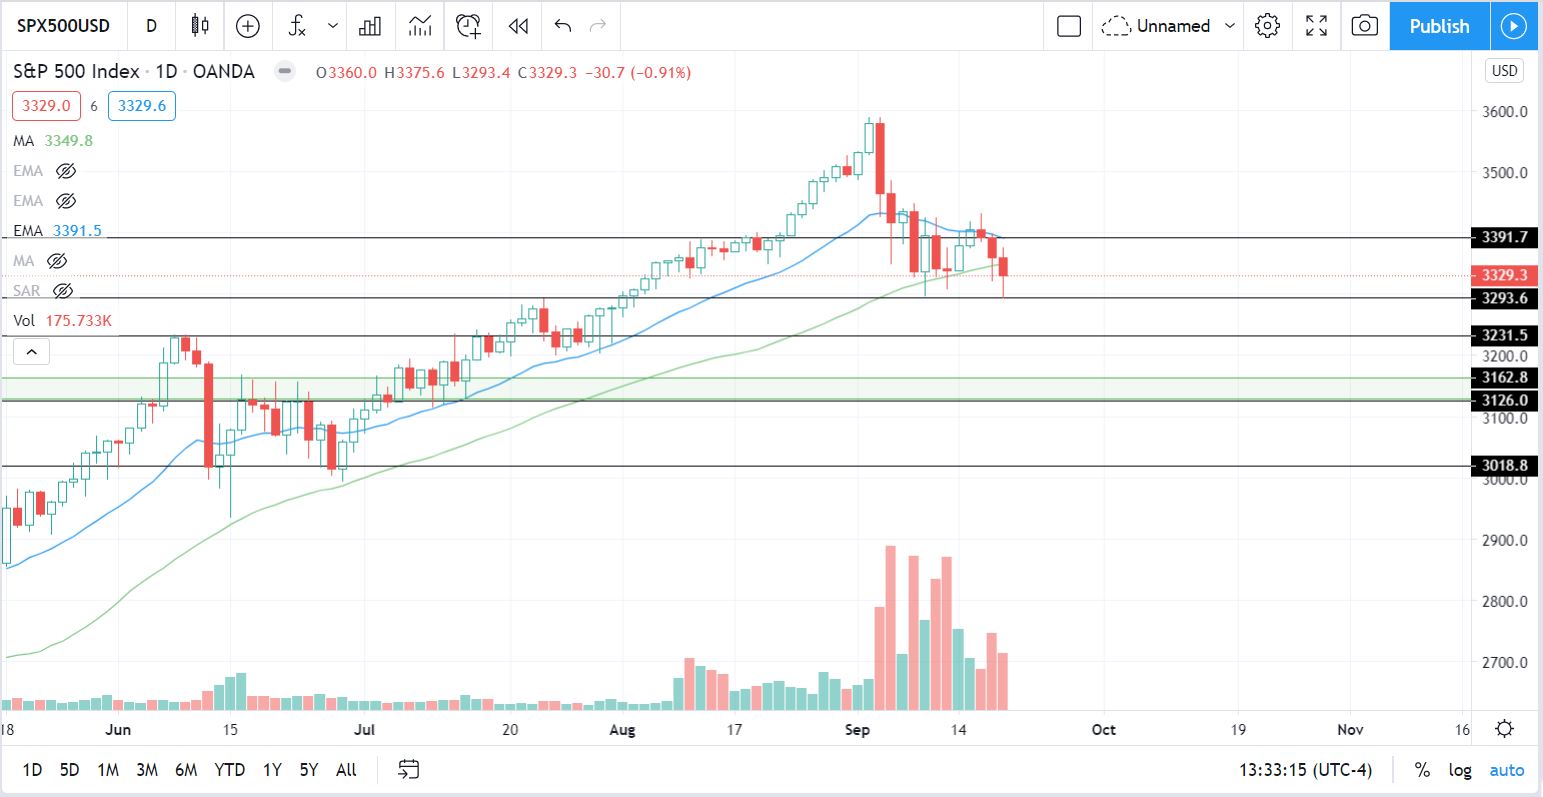 S&P 500 4 Hour Time Frame Chart: Zooming into the 4 hour time frame, you can see extra trend lines marked in orange. These are resistance levels for now. 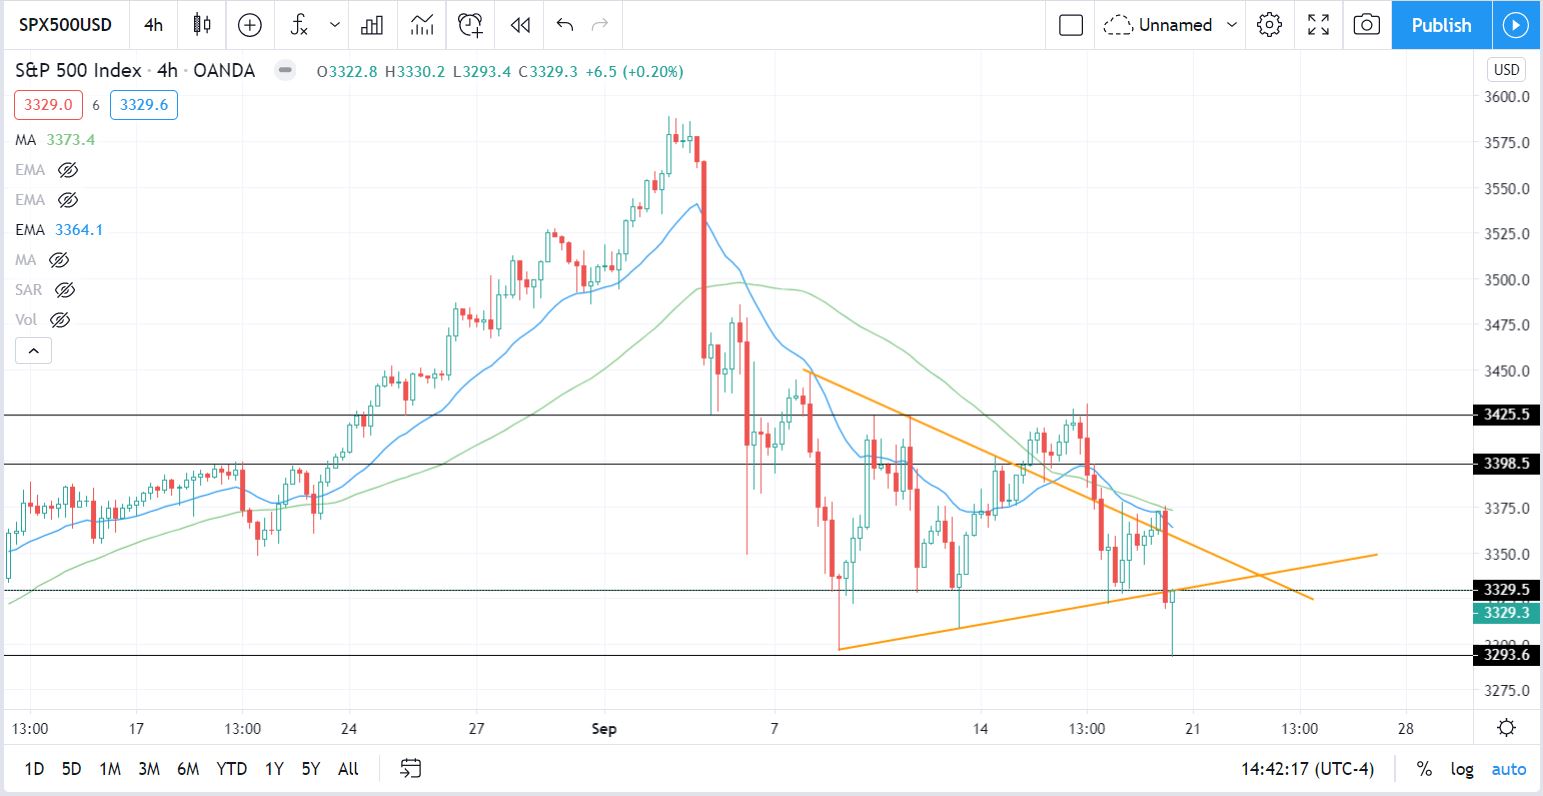 Fear & Greed Index: The Fear & Greed Index right now is neutral. This is a mixed signal as the market is currently indecisive and doesn't know where it wants to go, hence the recent choppy movements. The good news (for bulls) is that there is no real panic in the market right now as we will show below with the US 10 Year Yield. 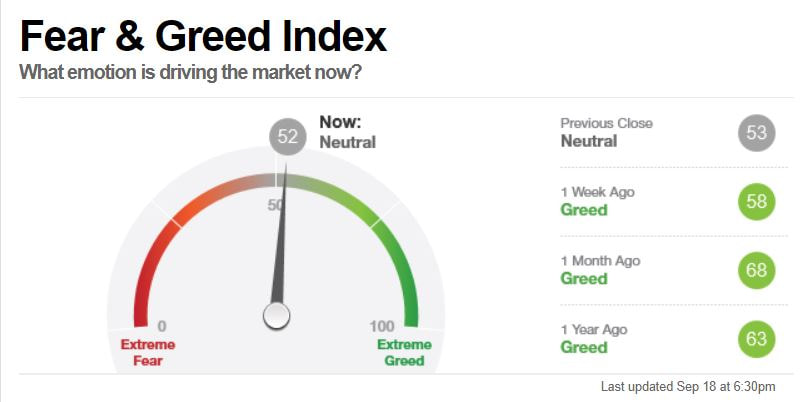 Taken from cnn.com US 10 Year Yield: During the recent sell-off in the overall market, the 10 year yield hasn't moved too much. If there was fear, the 10 year yield would have dropped as more investors would be piling into the safety of bonds (inverse relationship, yields go down when people are buying). the US10Y is in a range right now, looking neutral in our opinion. A break out to the upside can bring upside to the overall market and vise versa to the downside. 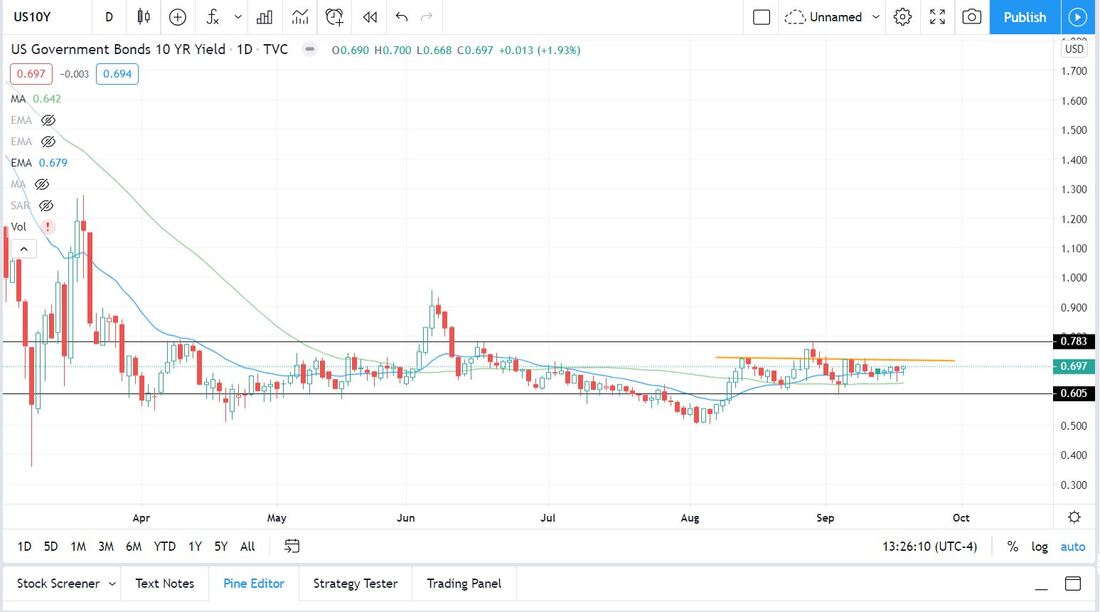 There was also no major flight to safety in the US Dollar Index during the sell-off, so again, no sign of panic. The Dark Pool Index (DIX): The DIX is a measure of dark pool buying in the S&P 500. Dark pool buying has been increasing since around last week, but nonetheless it is around a neutral mid-range number. 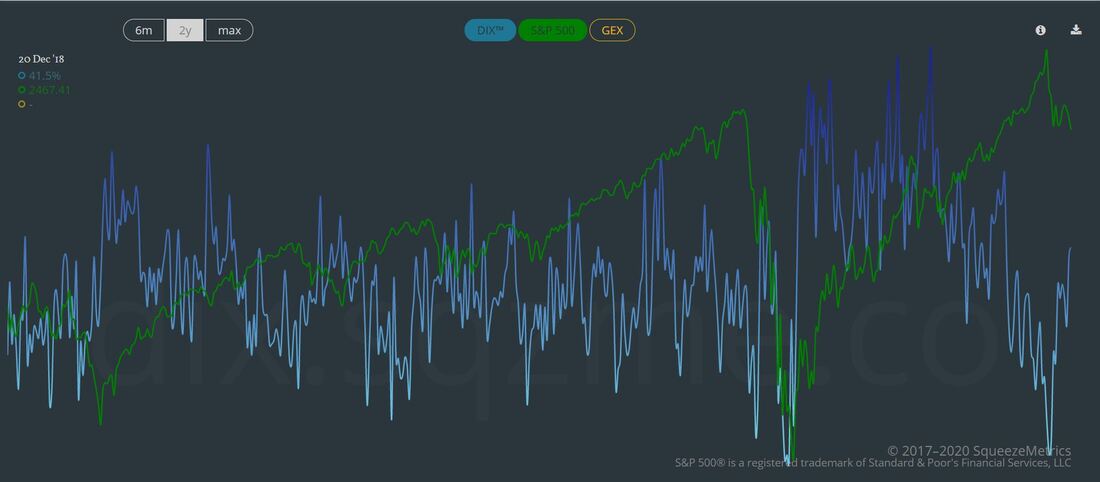 The DIX can be found on squeezemetrics.com Our overall analysis on the market this week based off these indicators is NEUTRAL, and the S&P needs to pass those resistance levels just above on the 4h time frame in order to consider being bullish. We are waiting for the market to show more signals of the direction it wants to go in before taking any swing trades on the indexes directly. That does not mean that there aren't any opportunities in individual stocks. Finally, here is this week's watchlist: 13 Stocks to Watch This Week1. NIO Inc. (NIO)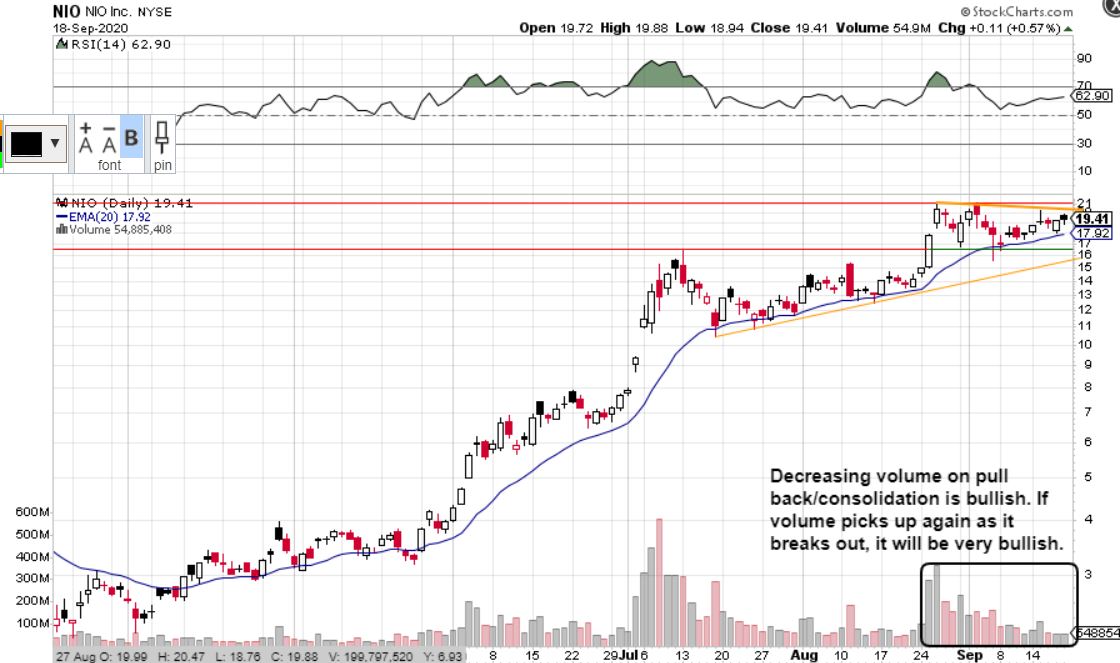 Overall, looking bullish. There are two resistance levels above to watch but a break out, especially on high volume, can make this stock see $24. Refer to the notes in the chart. 2. Tupperware Brands (TUP)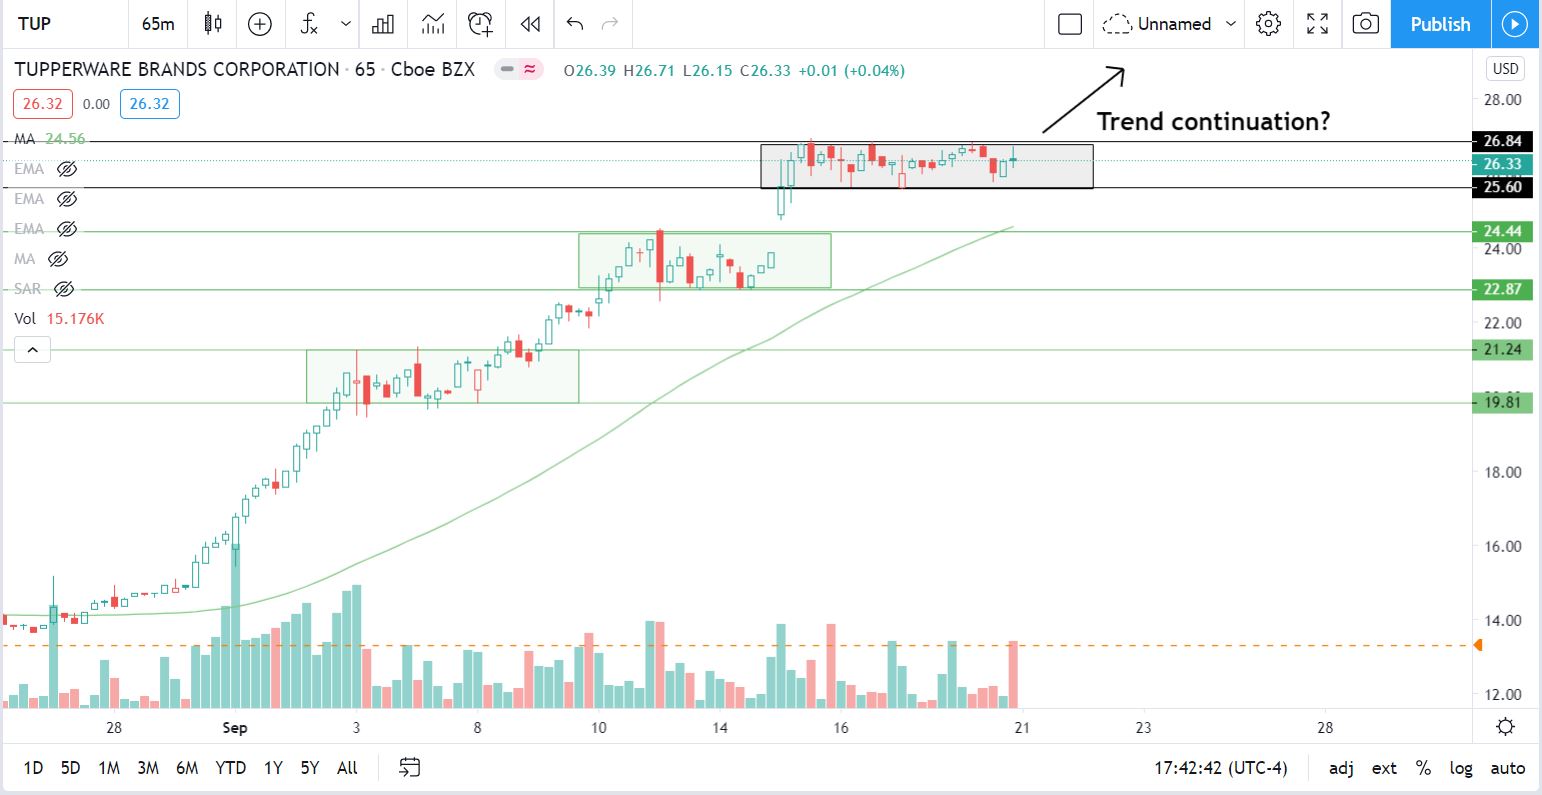 Here is a 65 minute time frame chart. This has been on our watch lists a lot recently and we predicted this big break out. You can view our TUP prediction from a few weeks ago here. It is overextended on the daily time frame, so the odds of it breaking out again are slimmer than before, but it can still happen. It looks bullish overall for now, until the trend breaks. We are looking for the exact same thing that happened the past two times in the chart above, to happen again. 3. General Electric (GE)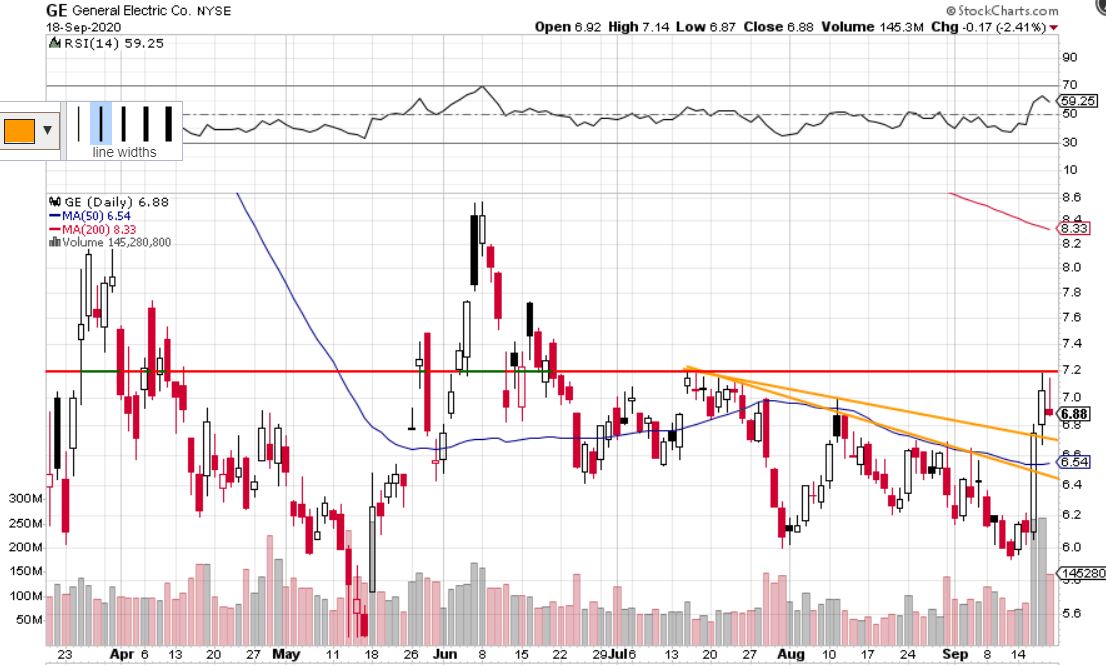 GE recently broke out of a descending trend line but in the past two trading days, it wicked around 7.20. Looking for a potential short if it shows more weakness and presents a good entry point back down to the closest orange trend line. Stop loss would be over $7.20 ish. 4. Tortoise Acquisition Corp. (SHLL)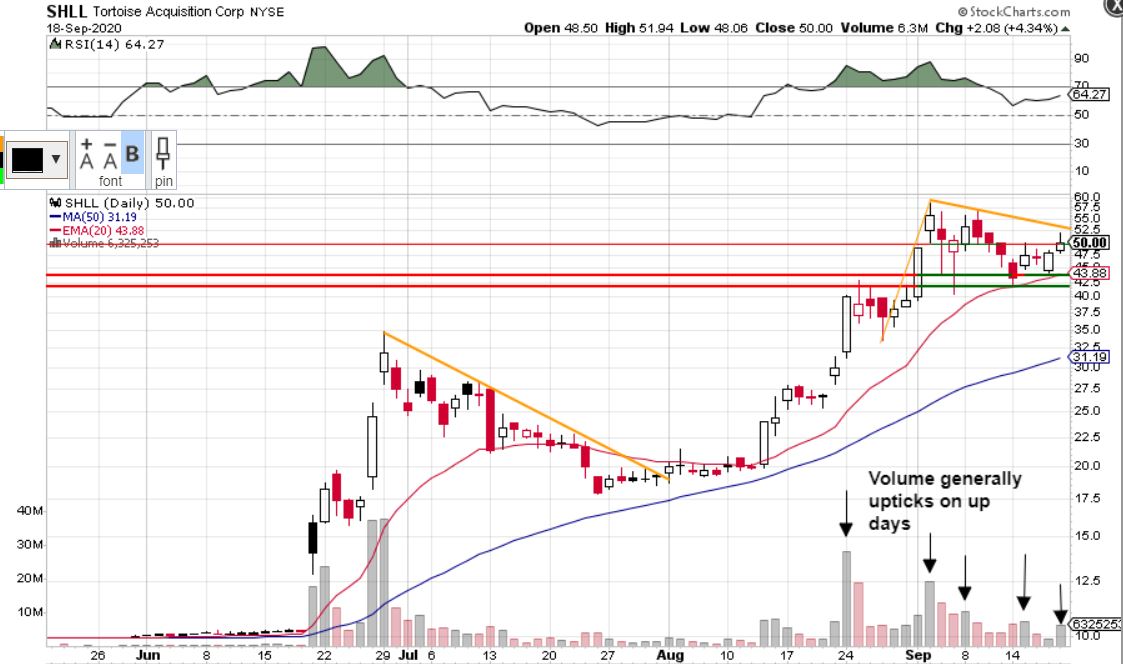 Looking bullish overall. It can have one more down move before heading higher (like it did in July) or it can break out from here. Not expecting this stock to break down because the volume patterns are bullish (noted in the chart). $52.50 is a break out level. Low 40's is support. 5. GOGO Inc. (GOGO)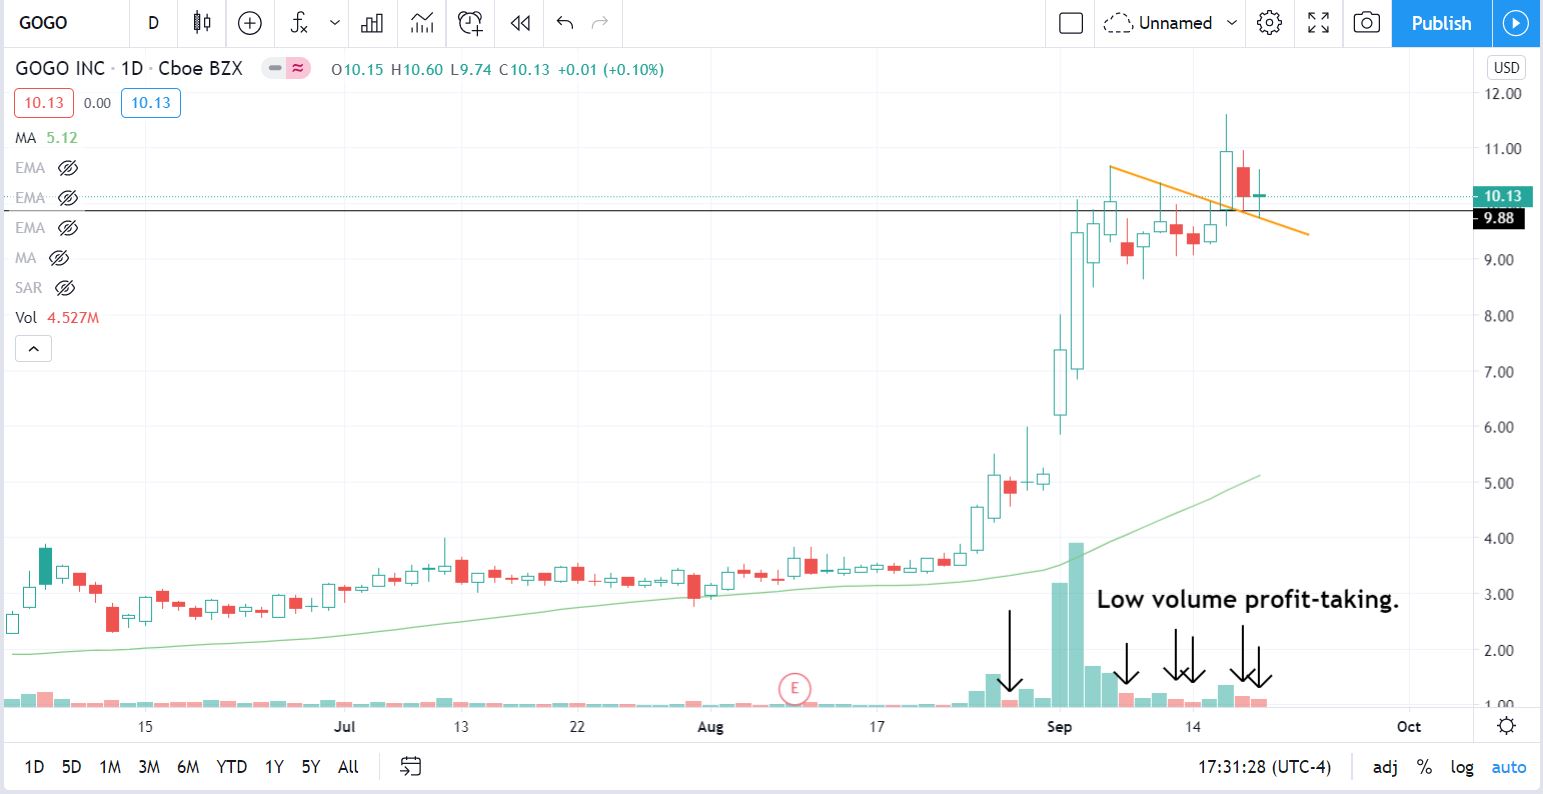 Here is a daily time frame of GOGO. It is bullish overall in regards to its trend and volume patterns. Let's take a closer look into the 65 minute time frame. 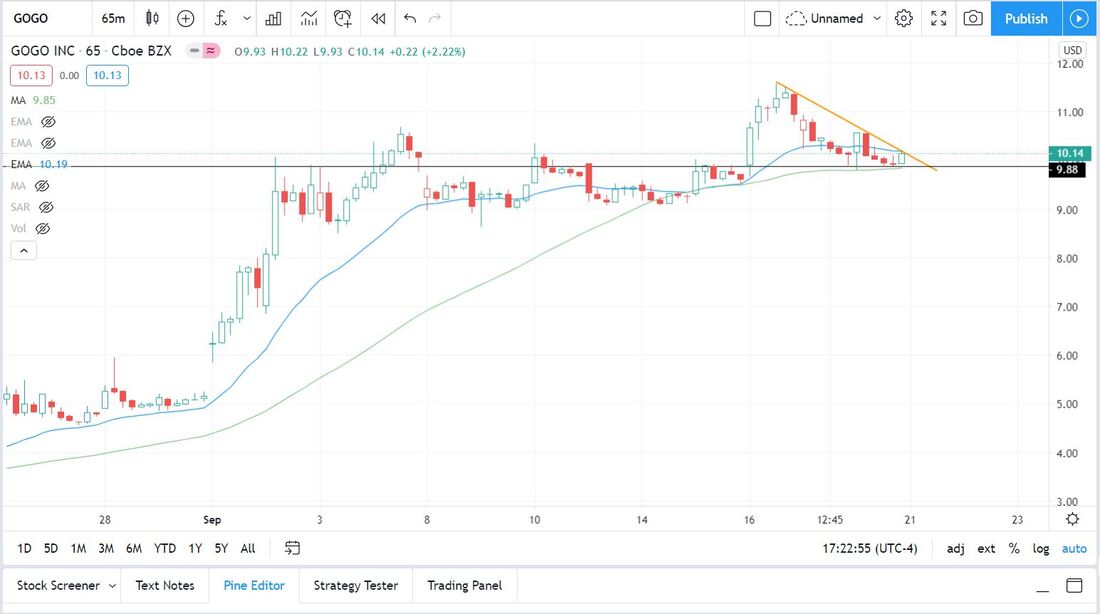 It is sitting on support and it can have a big break out over that trend line. GOGO is definitely one to pay attention to. $10.55 is the next resistance level above the trend line, but it is not a major resistance. 6. Dollar General (DG)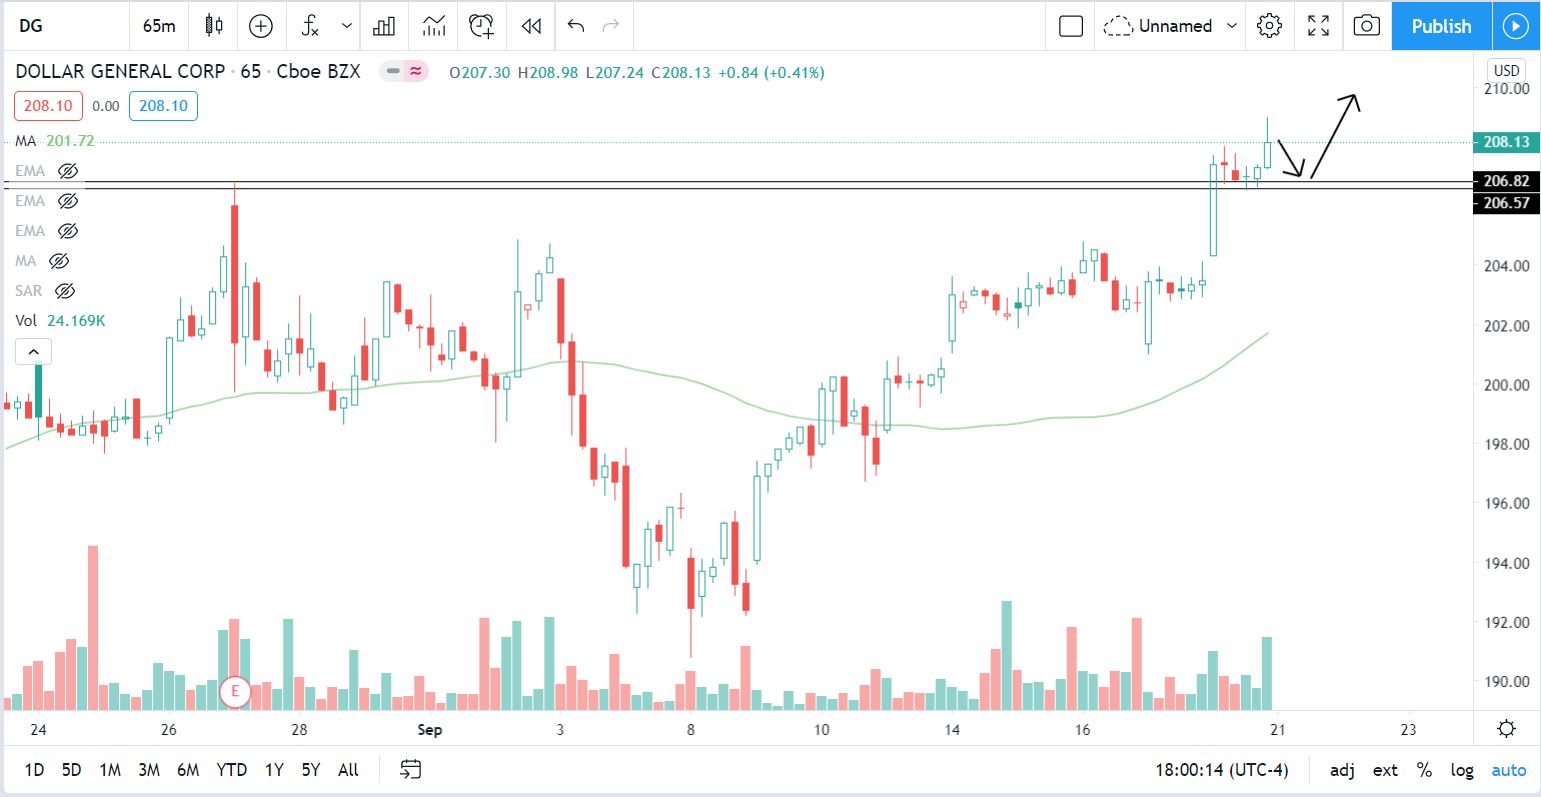 Above is a 65 min chart of Dollar General. We would only take this trade if it opened somewhere over 206.50 tomorrow (Monday) and then supported that level. Preferably we would want a support to be formed in the first 15-30 minutes of trading when volume is highest. The earlier, the better. If that happens, we would take a long position with a stop under 206.25-ish. Refer to the arrows in the image above. 7. Talend S.A. (TLND)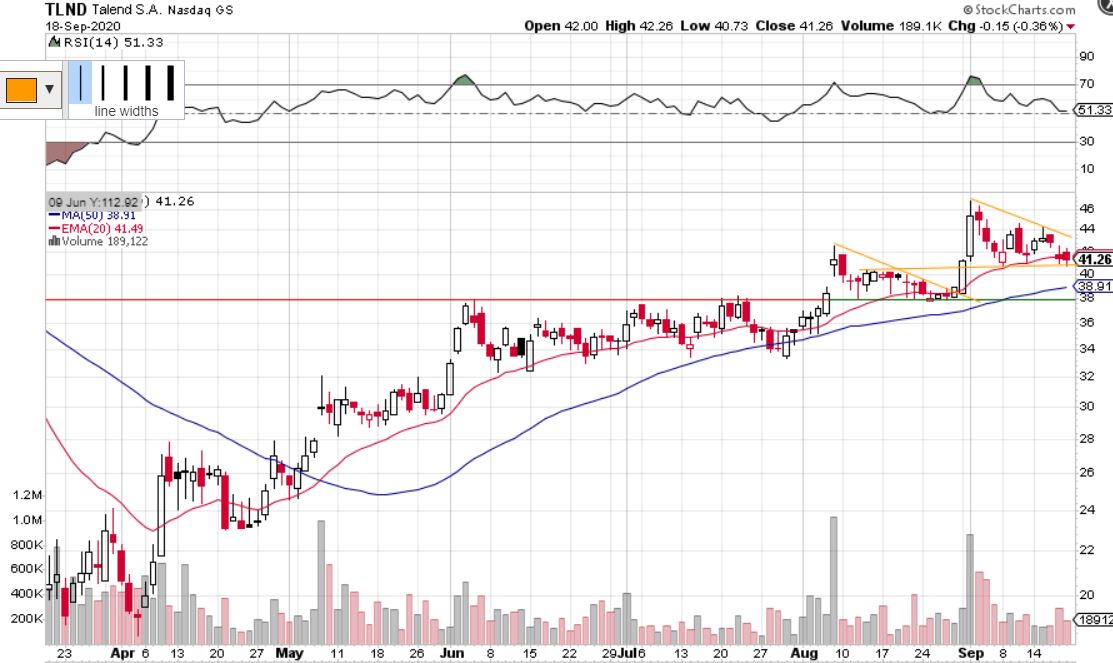 Bull flag, sitting on support. Look for a break out to the upside to go long. Wouldn't want to buy this under $40.50. 8. Target Corp. (TGT)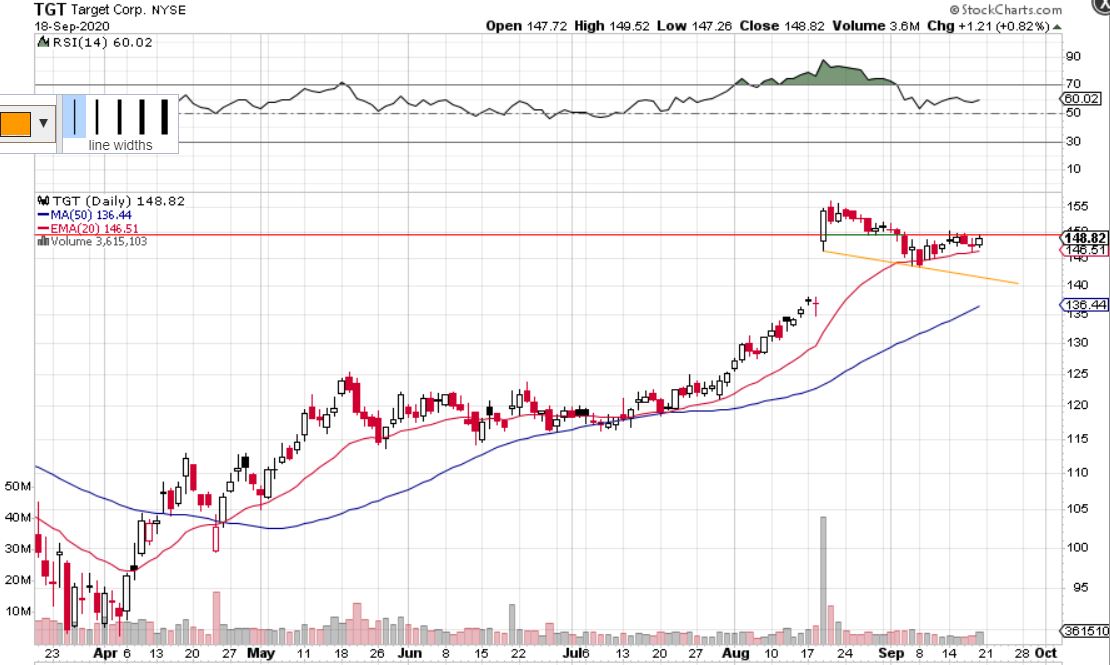 TGT has a gap to fill under $140. It had a major earnings beat a few weeks ago which was the cause of the gap. Powerful earnings winners tend to consolidate or pull back after earnings and then head higher. We are anticipating two potential scenarios for TGT. Either it forms a bottom where it is now and breaks the support just above (red line) to head higher, or it slowly heads to the orange line to fill the gap, and then heads higher from there (assuming the market conditions are neutral/bullish by then). No trade for now. 9. Docusign, Inc. (DOCU)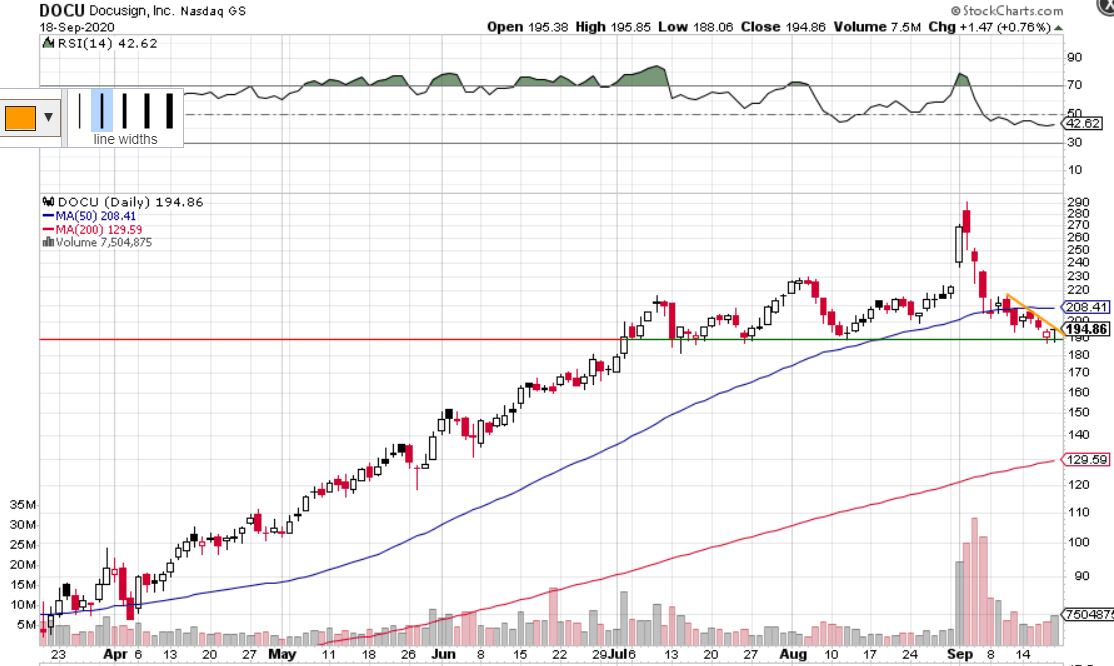 Falling wedge pattern and is at a support. It recently had big selling volume but we are watching for buying volume to pick up again and break out over the orange trend line. 10. Walmart (WMT)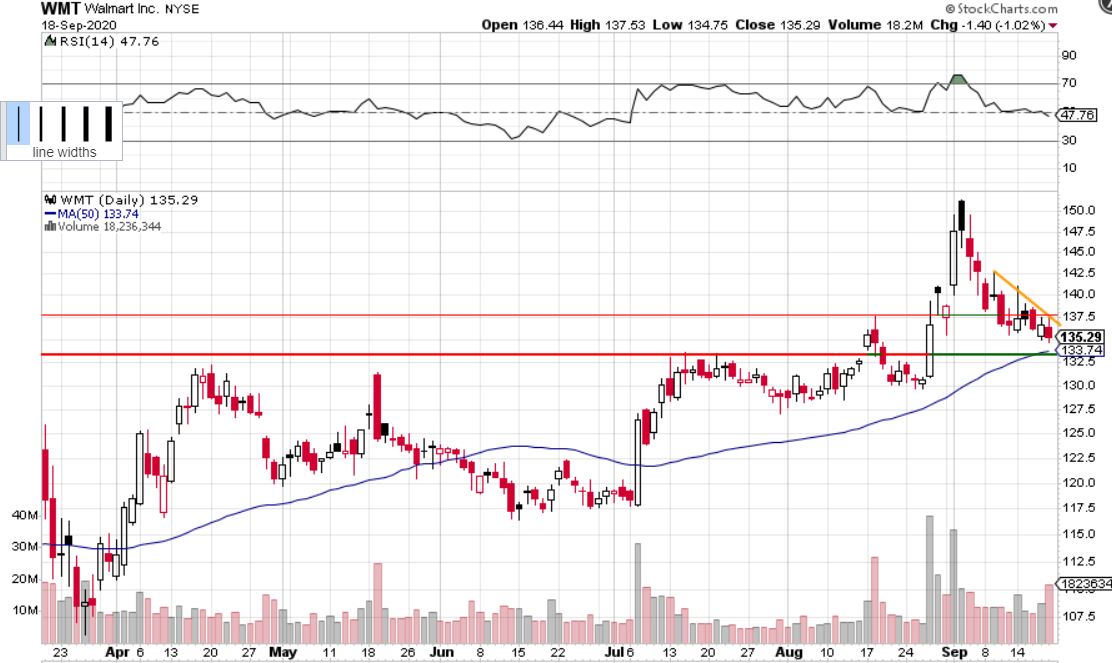 Similar to the Docusign chart just above this. 137.50 is the break out level we are watching. Walmart had news this weekend with the TikTok deal involving Oracle, so it may go up tomorrow. 11. Pacific Ethanol, Inc. (PEIX)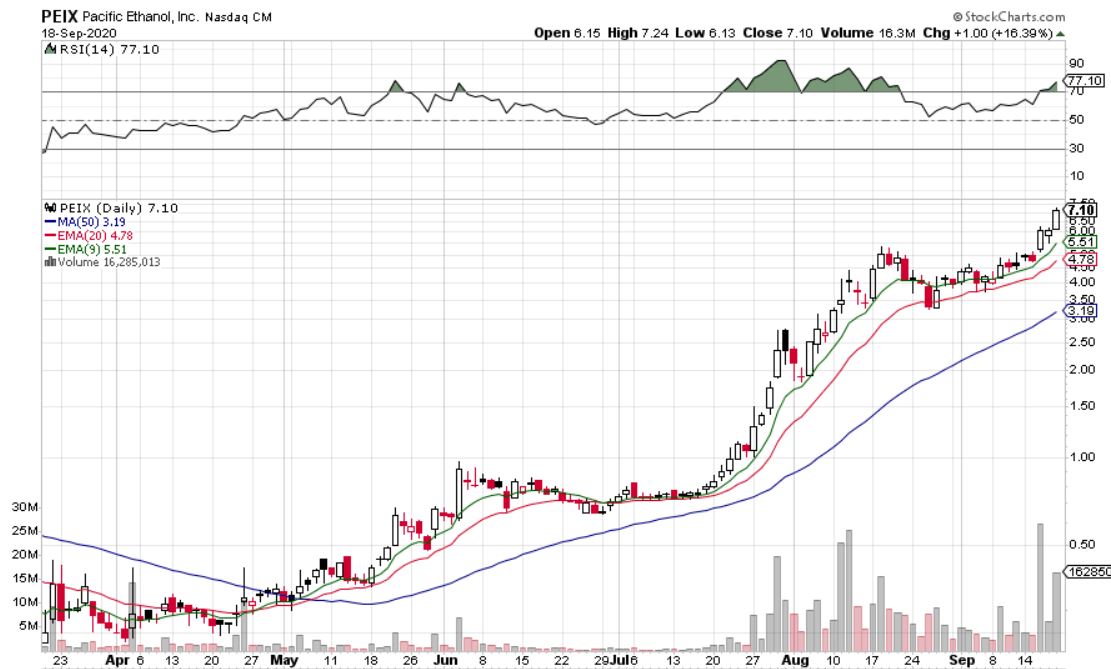 Looking to buy pull backs. Will be applying our momentum strategy to this stock. 12. Brookfield Renewable Partners (BEP)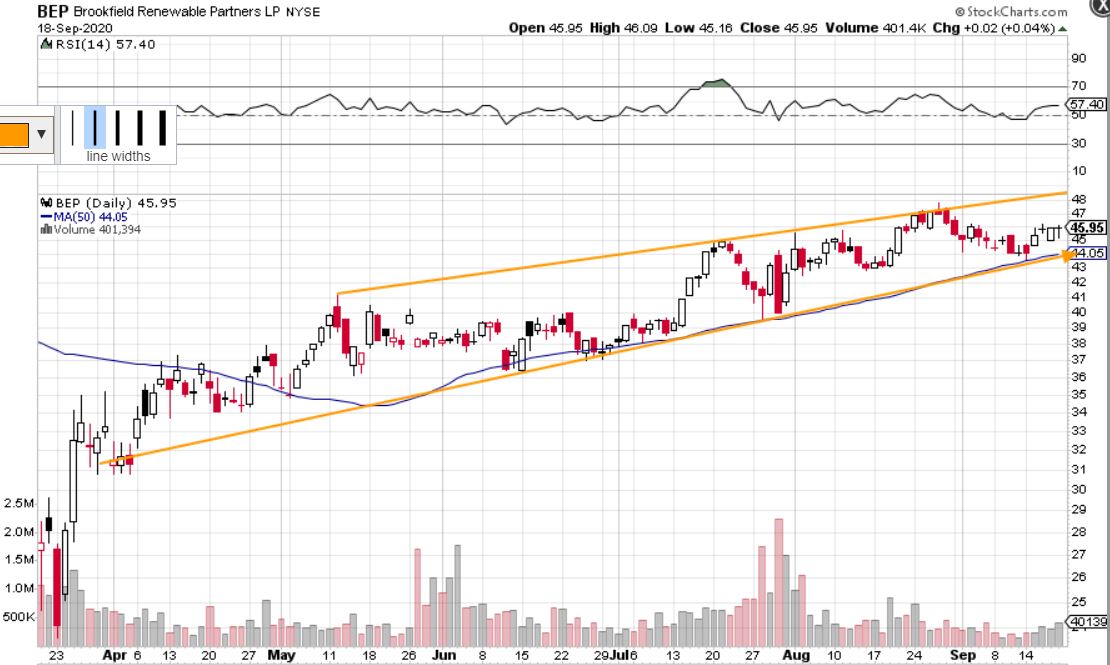 BEP is following this ascending channel. It is a good buy at the bottom of the range if it consolidates for a few days and lets the trend line catch up to its price. 13. Gold (XAU/USD)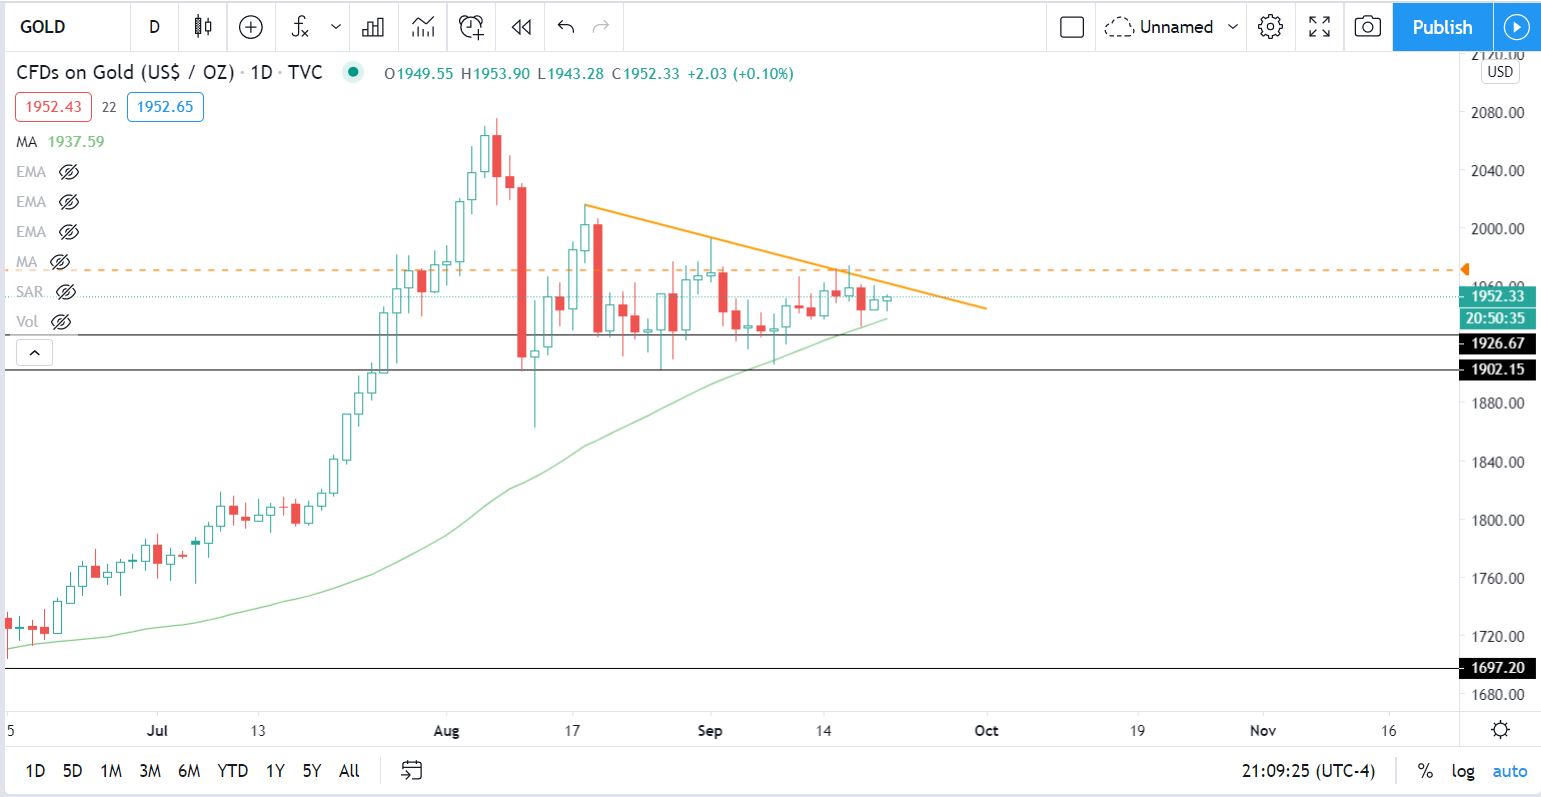 Most likely won't be buying into gold unless it convincingly breaks out of that trend line resistance. Nothing for now.
Thanks for reading! If you enjoyed this watch list, make sure to follow us on twitter or sign up for our free email list (scroll to the bottom of this page) to get alerted whenever we post a watch list or other educational content. |
 Categories
All
Archives
September 2022
|
 RSS Feed