|
This weeks' top stocks to watch include: WKHS, SHW, DADA, NIO, CARR, ZM, WMT, TSLA, CTAS, PEIX, RH, Z, DOCU, SGEN, JKS, F, X, and GME. These stocks are mainly meant for swing trading, but some can be day trades as well.  1. Workhorse (WKHS)WKHS broke out of its pull back on Friday. The pull back was a good retest of the previous highs set in July. Now WKHS seems ready to test ATH . Volume has generally been higher on green days which is bullish . Stop loss can be 22.50 or under 23.50 depending on risk tolerance. A morning dip would be an ideal entry tomorrow morning. I'd avoid buying right at the open if it gaps up. 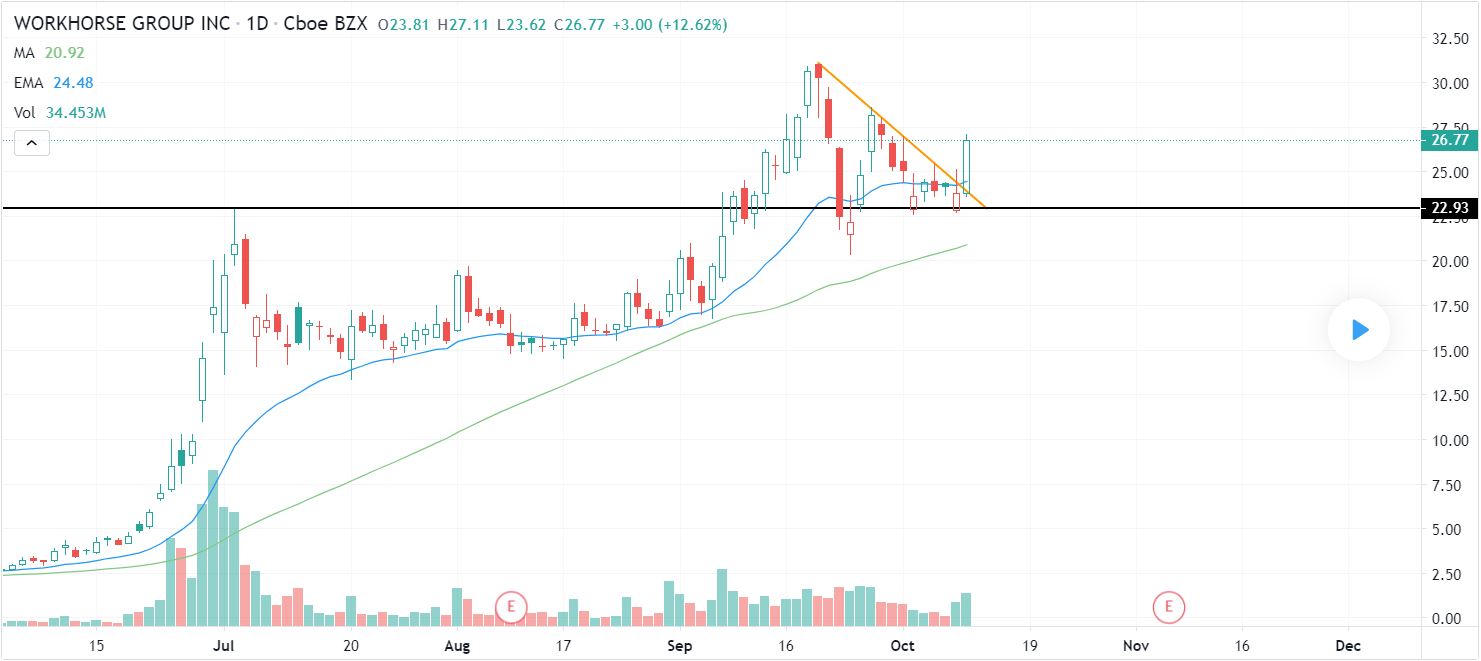 2. Sherwin-Williams (SHW)is forming a symmetrical triangle. This is a name with lots of momentum as it has been going up consistently for the past few months. Look for long entries with more reward than risk. First target would be previous highs, 2nd target is all time highs. Stop loss would be under $675 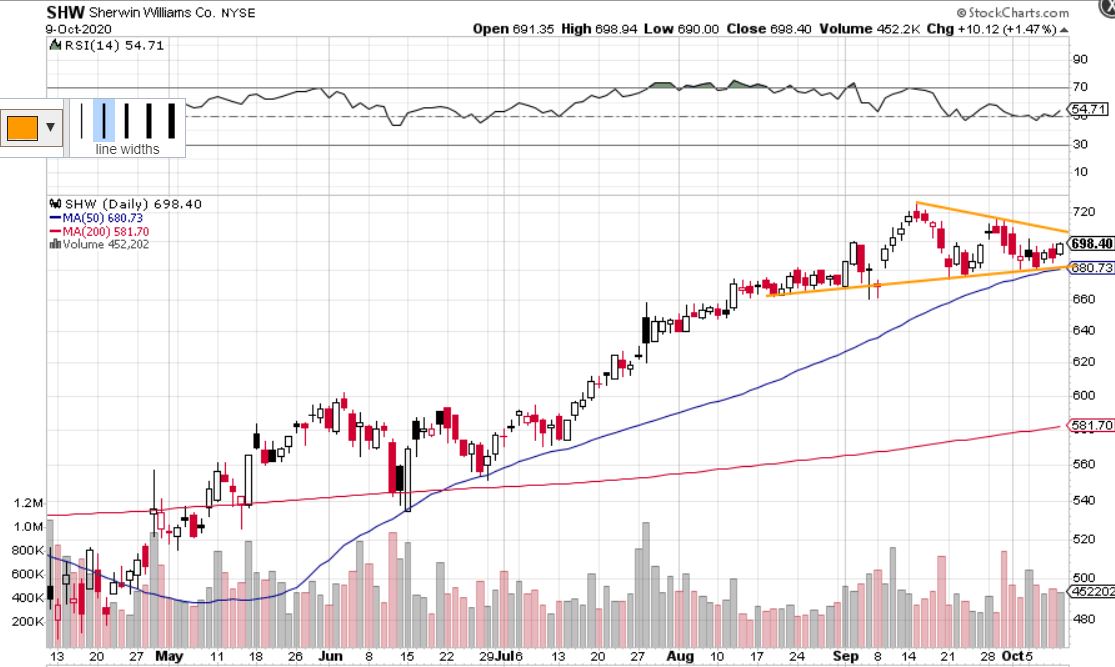 3. Dada Nexus (DADA)The chart says it all. Big break out on big volume. This can keep going, same idea as WKHS #1. 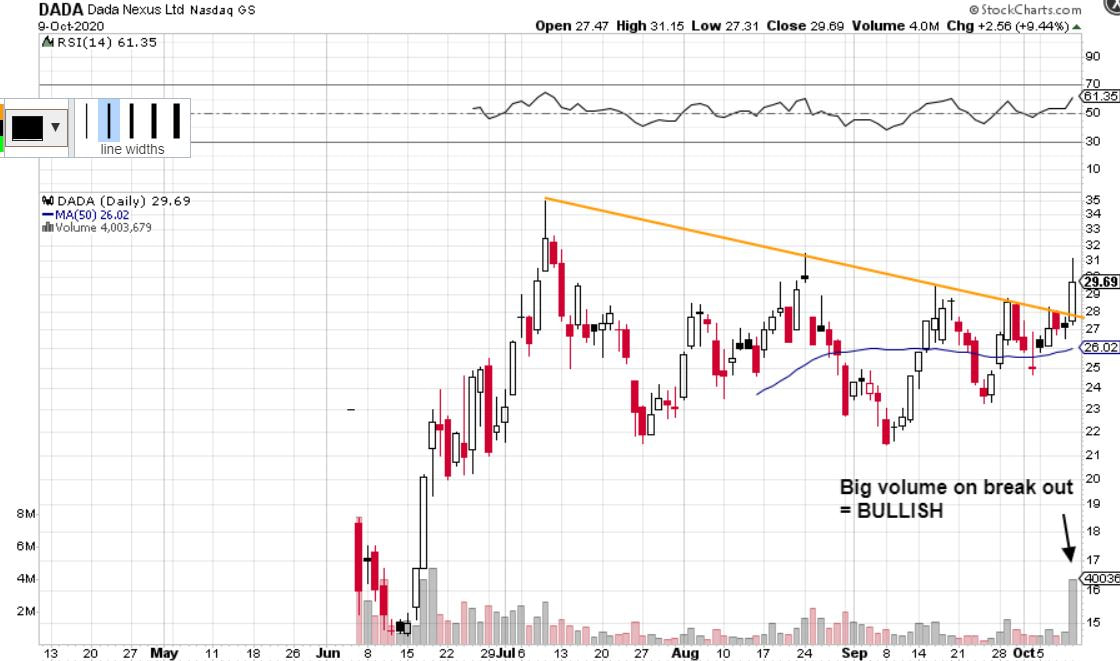 4. NIO Inc. (NIO)Patiently waiting for NIO to follow through here after breaking out of resistance on good volume 2 weeks ago. Expecting it to hit $24. Stop loss under $20.50 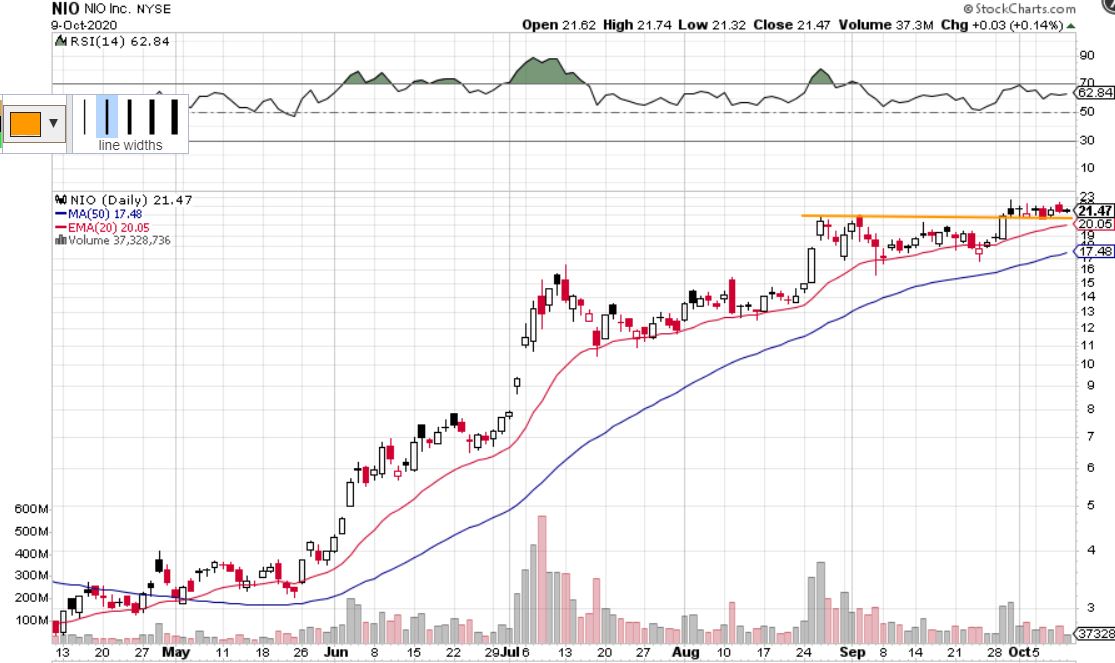 5. Carrier Global (CARR)Same idea as NIO above. Look for another day or 2 to hold at these levels for confirmation of support. 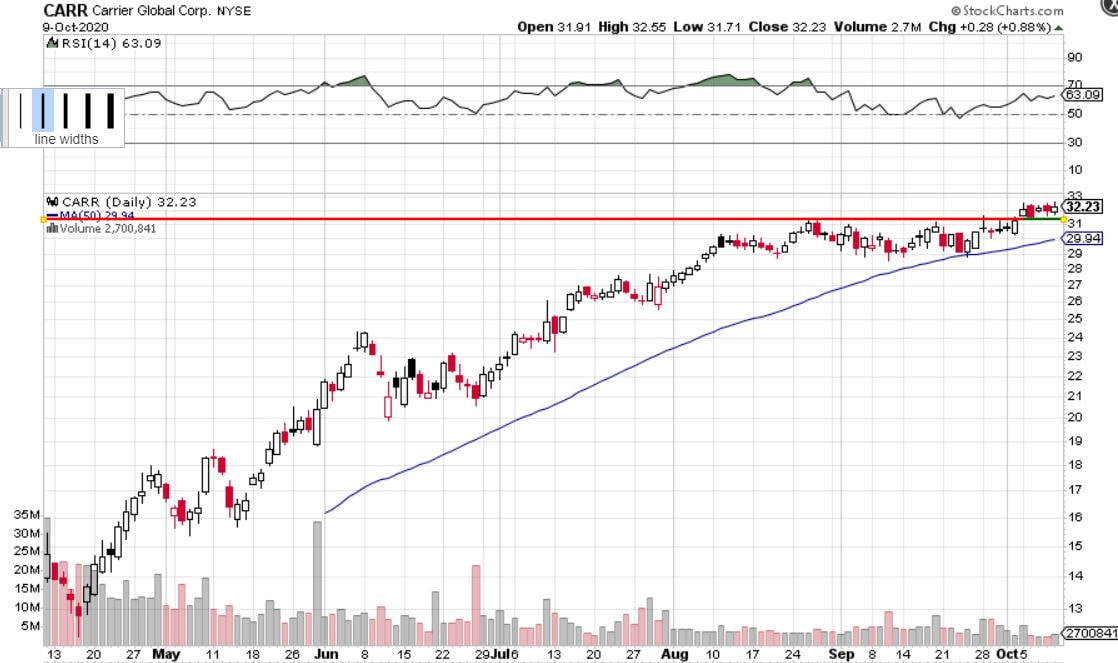 6. Zoom Video Communications (ZM)ZM broke out of a bull flag and is retesting the trend line. Long from $480 as it was mentioned in last week's watchlist. Still think it can go higher. Targets: ~510, 520, and 530. 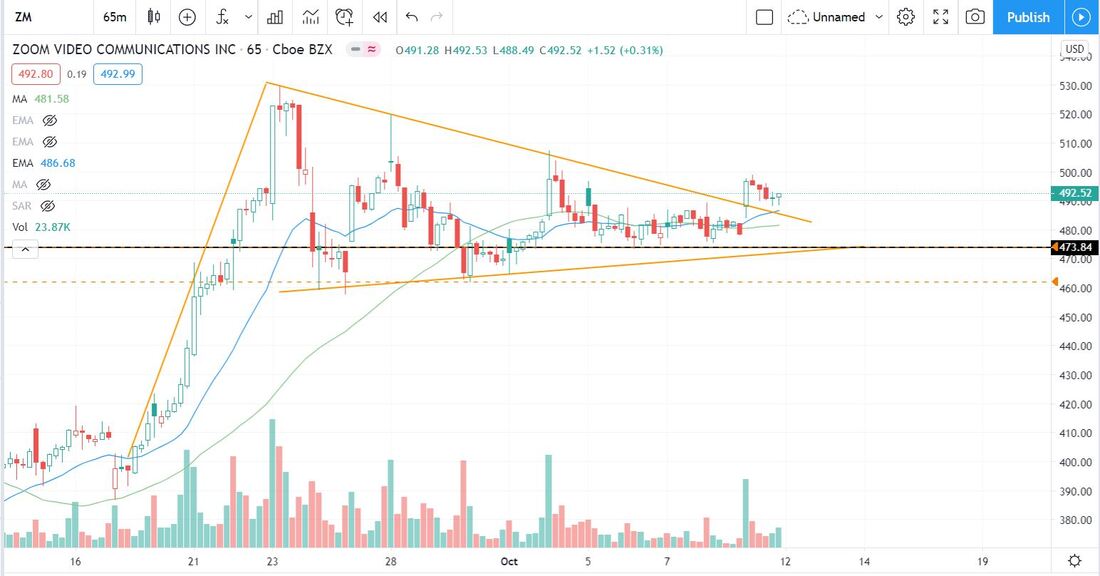 7. Walmart (WMT)Nice rounding out bottom that was mentioned in other watchlists is still forming. Look for some more consolidation on the 65 min time frame for a long entry. Expecting another leg up. Support around $140. 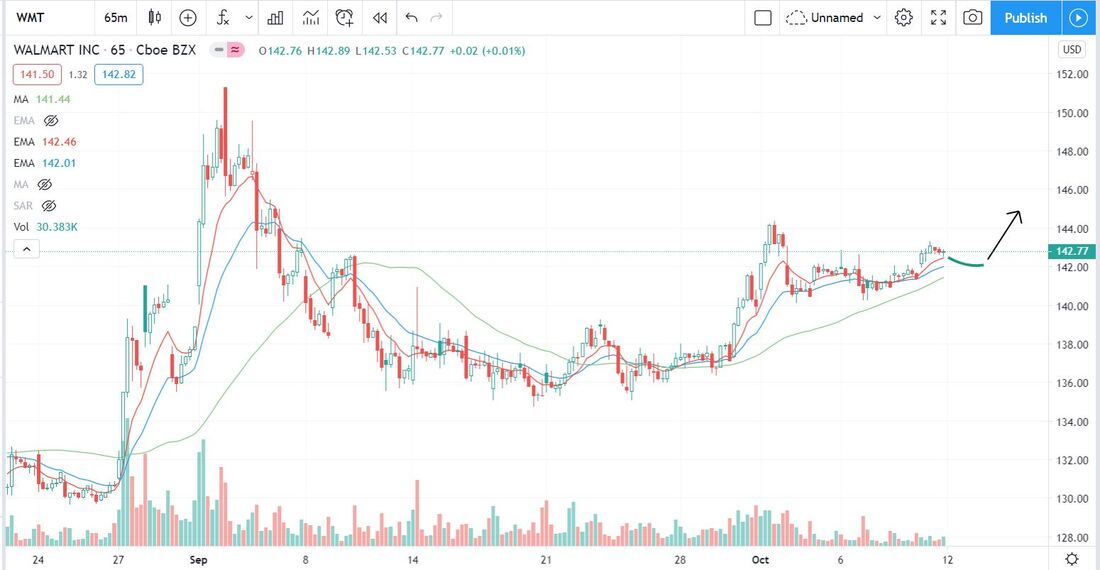 8. Tesla (TSLA)65 minute time frame. The overall trend for TSLA is up, so a bullish bias is needed here. It is currently in consolidation mode, but we expect that it can break out to the up side. No position for now. 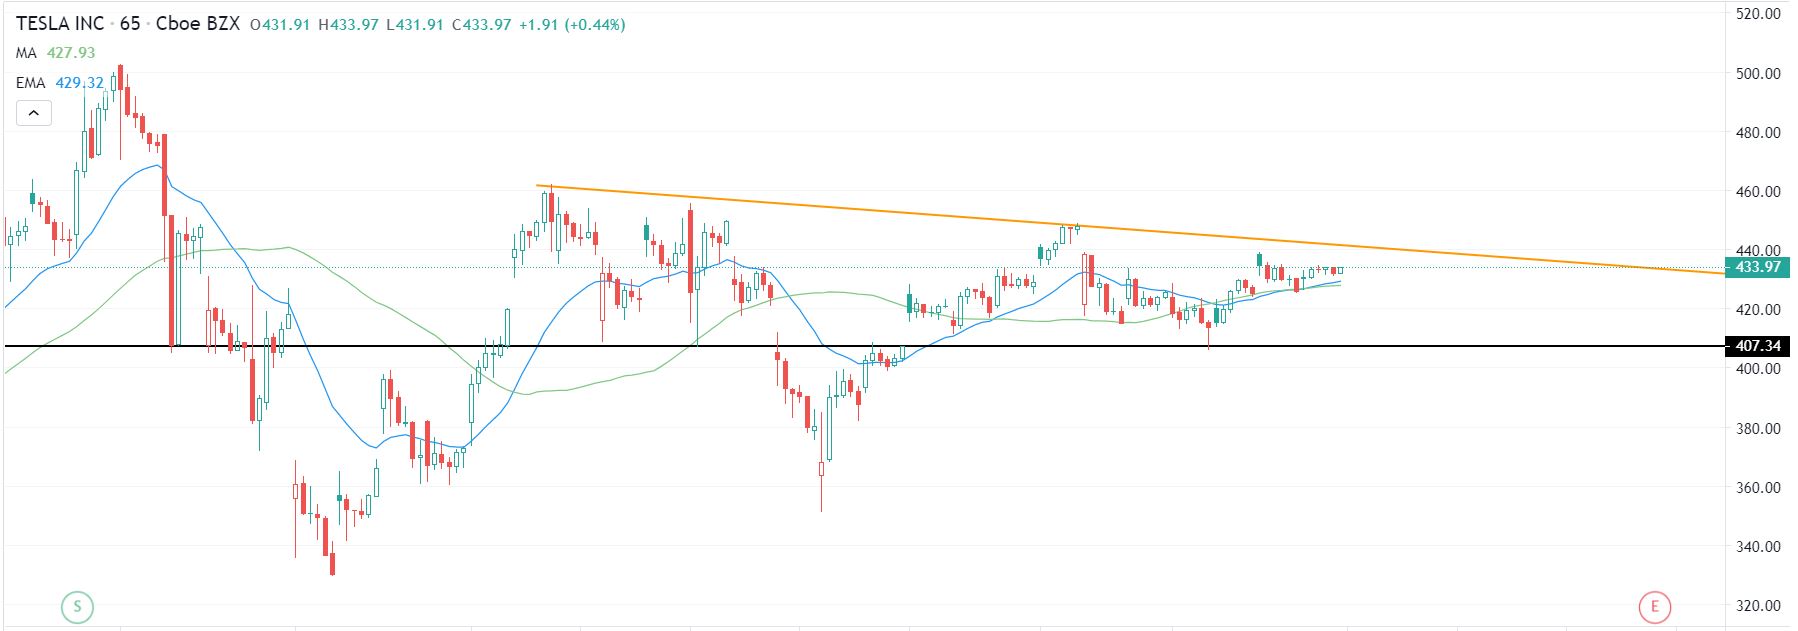 9. Cintas Corp. (CTAS)Looking for a break out over $345 or a few more days of consolidation around current prices in order to anticipate a break of $345. No position so far. 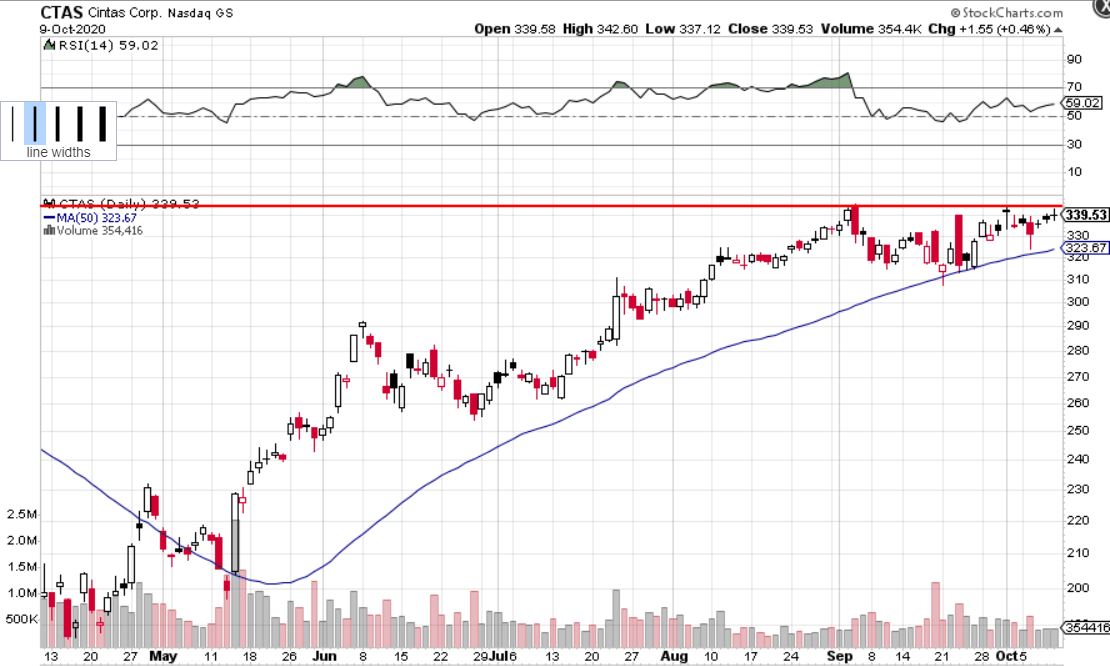 10. Pacific Ethanol (PEIX)Strong name, looking for continuation to the up side. Volume is bullish as it is higher on green days generally. Please refer to the notes written in the chart. We are using this momentum strategy. 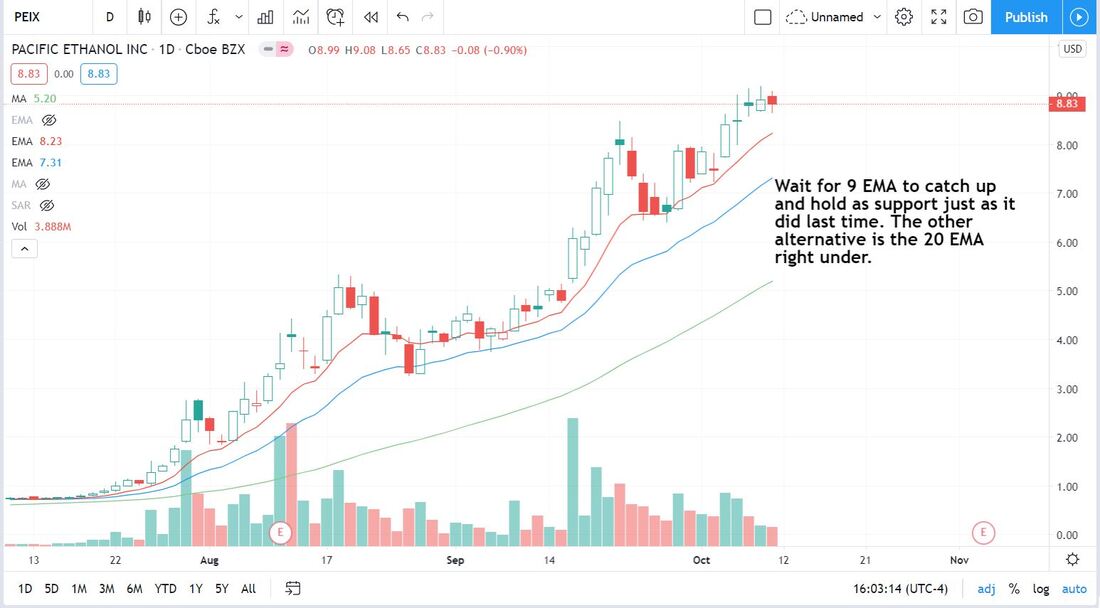 11. Restoration Hardware (RH)Another use of the momentum strategy. RH is likely to make a move higher off of the 20 EMA (red line). Waiting for 1 more green day for confirmation of support. 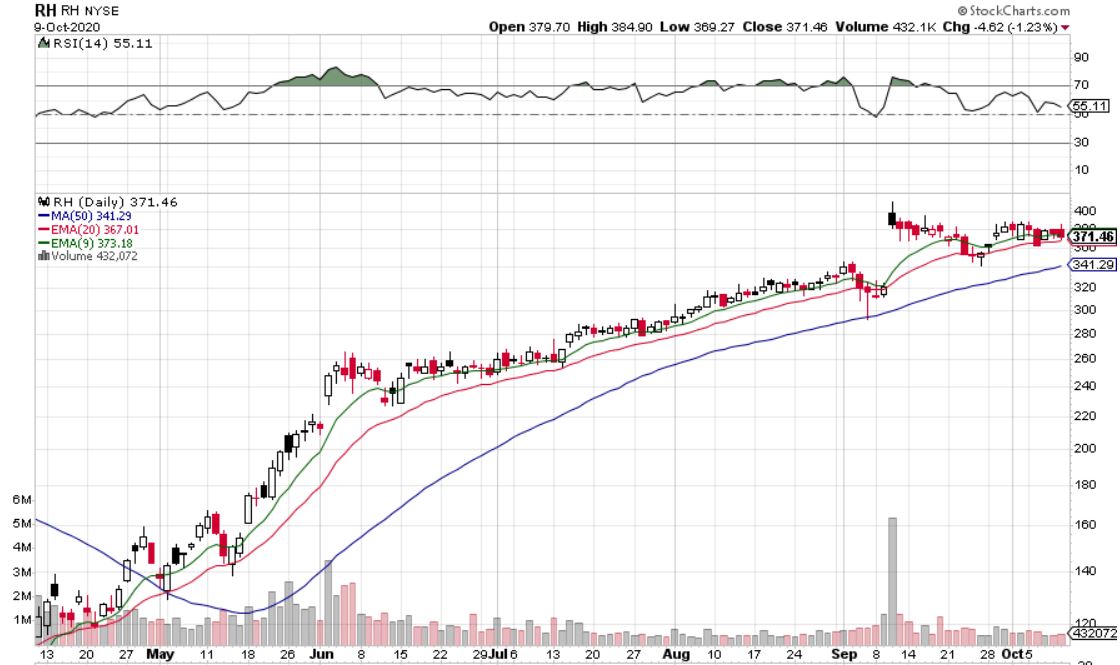 12. Zillow Group (Z)Same idea/strategy as PEIX and RH above (#10 and #11). Looking for 9 EMA to support. If not, eyeing 20 EMA. Volume is bullish.  13. Docusign (DOCU)This one seems neutral right now. Some may see a head and shoulders, others may see it supporting right now and on the brink of a break out. On watch for either a break out or break down, no position. 130 minute time frame chart (yes, 130m).  14. Seagen (SGEN)Similar to #10, 11, and 12. Look for support at 9 EMA for a long. Volume is strong on up days. Bullish overall.  15. Jinkosolar (JKS)Massive run up recently wow. Look to use this red to green strategy here.  3 Potential Shorts16. Ford Motor (F)The market is undoubtedly in an up trend. Therefore, we usually have many long positions open. Sometimes we will short weak stocks to hedge long exposure. Ford seems like an ideal candidate here after that engulfing candle at resistance. Try to get a good risk to reward entry. Stop loss above $7.45, target near $7.10. 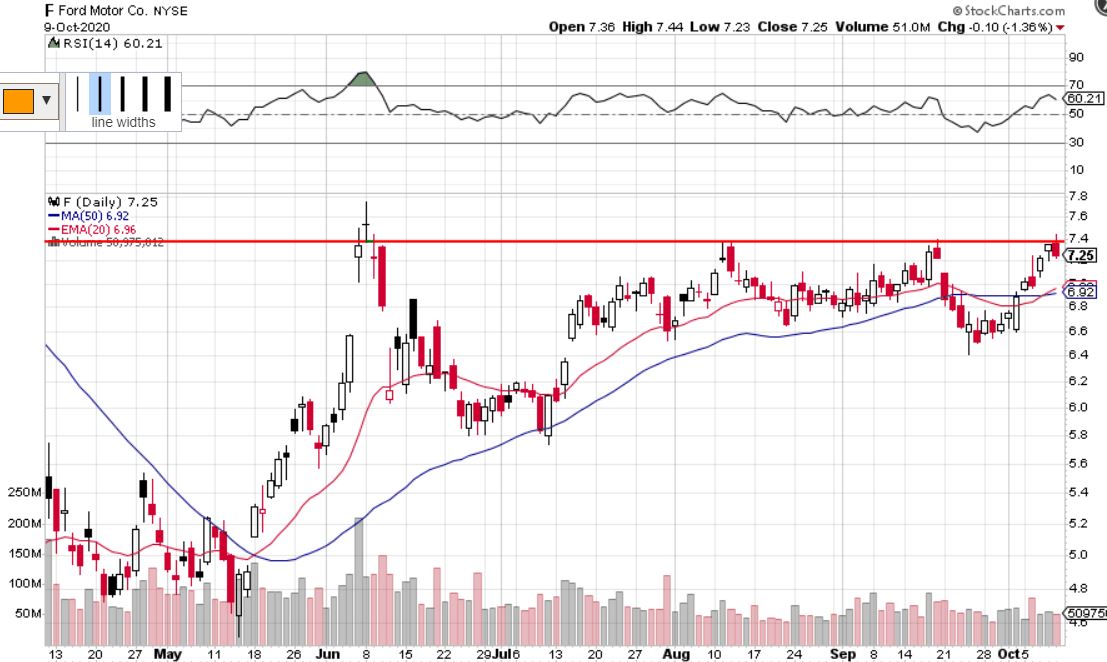 17. United States Steel (X)Another engulfing candle chart. This stock has been weak overall. Wouldn't mind shorting it as a hedge with just above $8.80 as a stop loss. Target would be $8 first so risk/reward entry would have to be greater than 1:1. 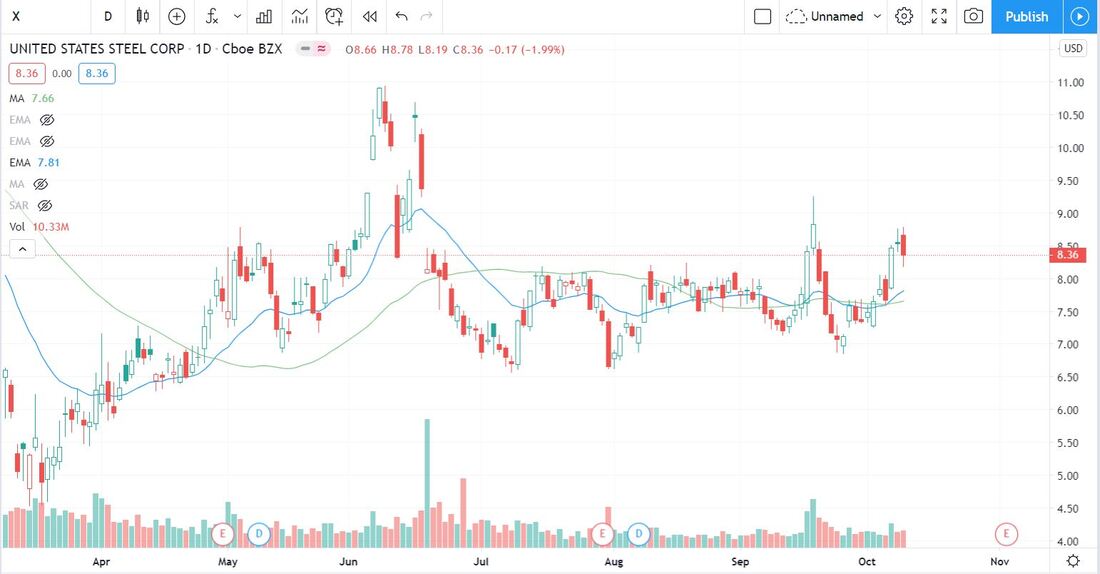 18. GameStop (GME)Although we were bullish on GME 2 weeks ago in our watch list, the tables may be turning in the short term. Friday's bearish candle on high volume indicates that momentum could be shifting. This is a dangerous stock to short, but it could be worth it. Look to short if it pops tomorrow and starts showing signs of weakness, possibly near $12.50. This may be better suited as a day trade than a swing trade but we will see. 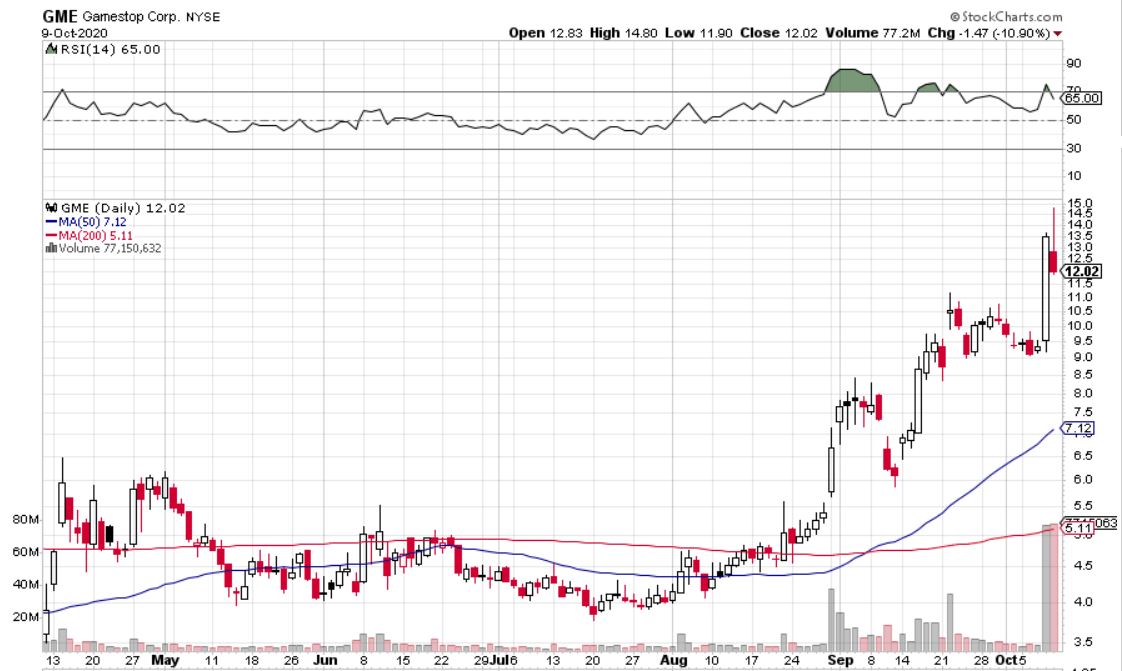 Need Charting Software?A great charting platform that we would recommend for serious traders is Tradingview. We use it every day as it has many useful tools and is very customizable. There is also an active trading community where people from all over the world post their trade ideas, so you never run out of ideas. Sign up through this link to get up to $30 to put towards a plan of your choice (or get the free plan). Thanks for reading! If you enjoyed this article, please consider following us on twitter @StockBrosTrades and/or subscribing to our free newsletter to get articles like this sent to you when they are posted! |
 Categories
All
Archives
September 2022
|
 RSS Feed