 When it comes to the stock market, there are generally two types of participants: Investors and speculators. Speculators tend to use technical analysis while investors tend to use fundamental analysis. Which is better? Can you combine both? Learn more here. The investor category can be broken down into smaller categories such as active and passive. The active investor will try to pick individual stocks by focusing on a company's fundamentals such as revenue, profit, cash flow, balance...etc. On the other hand, the passive investor will invest in an index fund such as an ETF or mutual fund and simply try to capture the market average. The most popular index fund is the SPY which tracks the S&P 500 and has averaged an 8-10% annual return since its inception. Investors typically have a long time horizon which ranges from 1 year to a lifetime. Unlike investors, the speculators base their buying and selling on price patterns and have much shorter time horizons. A speculator will generally hold a stock for as little as a few seconds to as long as a few months. Often times, charts are used in order to discover and track historical patterns in an attempt to anticipate a stock's next movement in price. Although there are many different styles for both investing and speculating, for this article I will be focusing on only 2 main styles: Value Investing and Technical Analysis. What is Value Investing?Simply put, value investing is a strategy where an investor tries to buy stocks at a discount to their intrinsic value. Value investing has worked very well in the past and will continue to work well in the future because it's based on common sense. The beauty of this approach is that it makes the investor think like an owner of a business rather than just a person buying shares in the hopes that they will appreciate in value. If you were to buy a business outright to have 100% ownership, which companies would you prefer, the ones who are seeing losses grow and have a lot of debt or the ones who are seeing their profits grow with low debt? Although there are no guarantees, this perspective will definitely help weed out those terribly volatile companies that usually end up bankrupt or see massive declines in value. How to Value a Company Using Fundamental AnalysisValue investing is tricky because what one investor sees as value another sees as garbage and that's what makes a market. There are many different fundamental analysis methods people can use to determine the value of a company. However, these methods can be grouped into 2 categories: absolute and relative value. Absolute value is estimating what the price per share ought to be based on a company’s fundamental analysis. The discounted cash flow model (DCF) is the gold standard for valuing companies. The way it works is that an investor will estimate future free cash flows, discount them back to present and then add it all up. The sum of these cash flows represents the intrinsic value of the company being analyzed. For example, an investor wants to determine the absolute value of company "A" using a 10% discount rate. Let’s assume the company will generate $100 in free cash flow in year 1 followed by a 5% increase every year up to year 5 after which it will be reduced to 2% per year. The calculation would be as follows: 100/1.10 + 105/1.10^2 + 110.25/1.10^3 + 115.76/1.10^4 + 121.55/1.10^5 + 123.98/0.08 = $1,965.80 Or 90.90 + 86.78 + 82.83 + 79.07 + 75.47 + 1549.75 = $1,965.80 Therefore, we now know that the company is potentially worth $1,965.80. If its current market cap is $1,000 then we can say that the company is undervalued. Below is an example of a DCF analysis on Alphabet, Inc. (GOOG) using Finbox to automatically input the data (which you can manually change for the calculation as well). 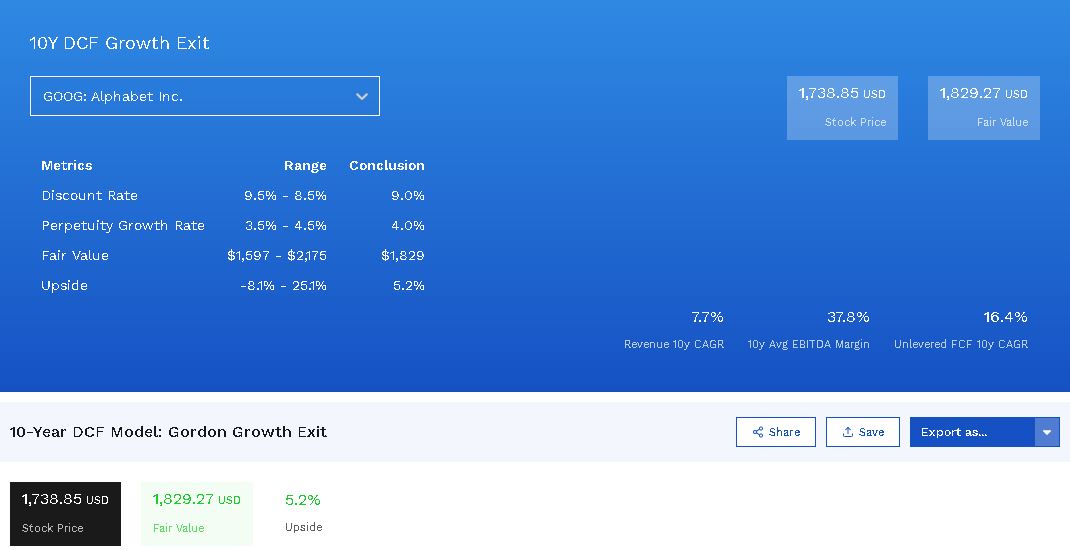 Example of Discounted Cash Flow analysis. 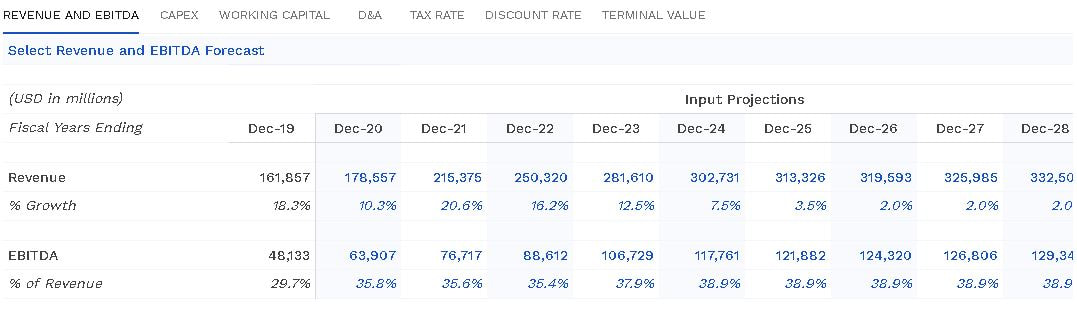 Automatic inputs that can be manually changed using Finbox. Finbox is a great tool that we recommend for fundamental analysis. As investors and writers for Seeking Alpha, we use it all the time. Learn more about Finbox here. Moving on from DCF analysis, relative value is when a company is compared to key competitors in order to assign an appropriate multiplier based on its market position relative to the other companies. Commonly used multipliers include price to earnings, price to free cash flow and enterprise value to EBITDA. The higher the multiple the more expensive the stock is. For example, let’s say we are looking at 3 different competitors in the retail industry and we want to use the price to earnings ratio (P/E). Company A is trading at a P/E of 10, company B a P/E of 20 and company C a P/E of 25. While analyzing the companies, we determine that company B is actually a stronger competitor than Company C. Since company C is trading at a higher multiple despite being weaker than company B we would conclude that company B is undervalued whereas company C may be overvalued. 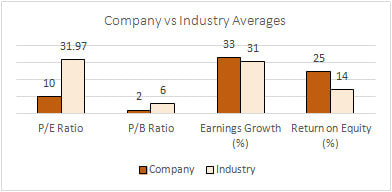 Example of comparing a company to the rest of the industry.
|
 |  |

Categories
All
Educational
Learn Fundamental Analysis
Learn Technical Analysis
Research Reports
Stock Market Books
Stocks To Watch
Archives
September 2022
April 2022
March 2022
February 2022
January 2022
December 2021
November 2021
October 2021
September 2021
August 2021
July 2021
June 2021
May 2021
April 2021
March 2021
February 2021
January 2021
December 2020
November 2020
October 2020
September 2020
August 2020
July 2020
June 2020
May 2020
March 2020
December 2019
August 2019
July 2019
April 2019
 RSS Feed