 Here's this weeks' stock watch list. The stocks to watch are: CAI, FCX, RCII, DISCA, VIPS, MX, KSS, FINV, FB, SHOP, and KL. Happy trading! Note: If any charts are too small to see, you can click on them to see the full image. 1. Cai International (CAI)Potential ABCD formation. Few more days forming "C" would be ideal to target new highs. Stop loss under C or B. Recent volume patterns look bullish. Read: How to Use Volume Analysis to Trade Stocks 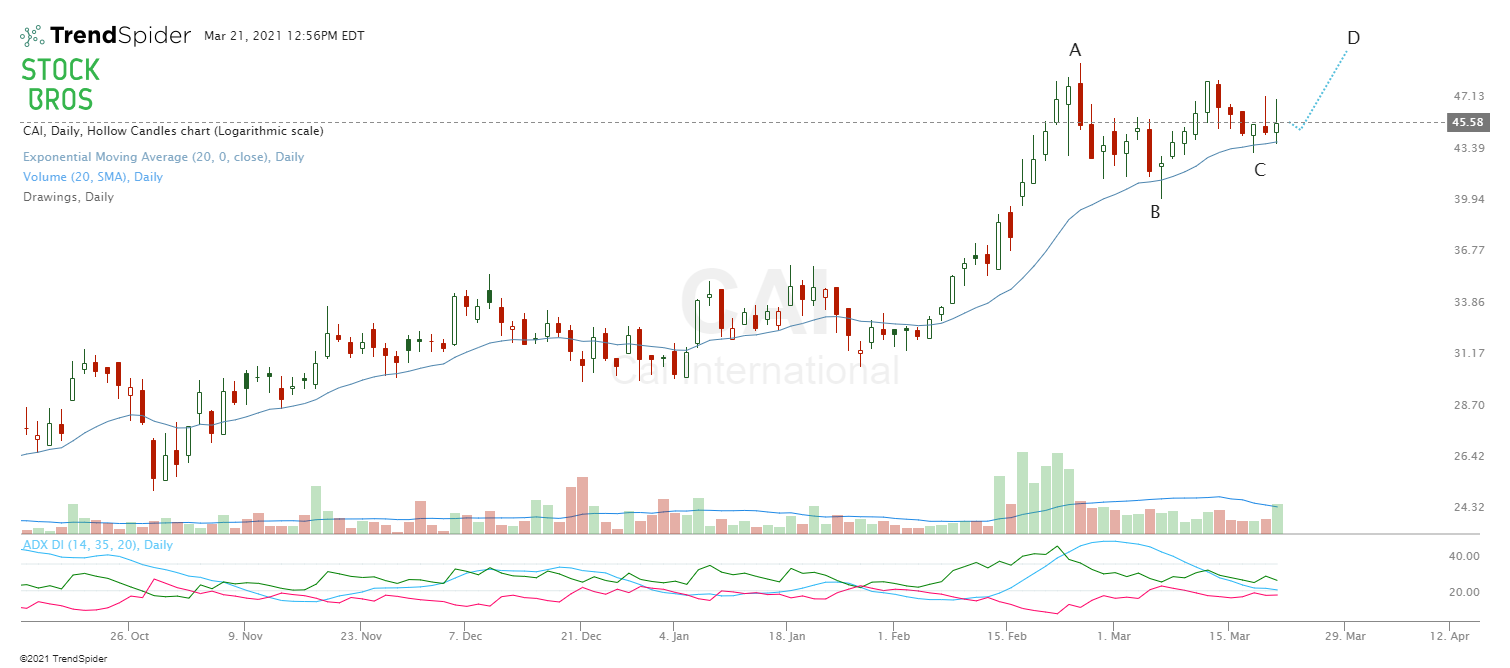 2. Freeport-Mcmoran (FCX)Same idea as the CAI chart above, just a little bit earlier in the ABCD process. This would need some more time holding around this level to be truly effective. 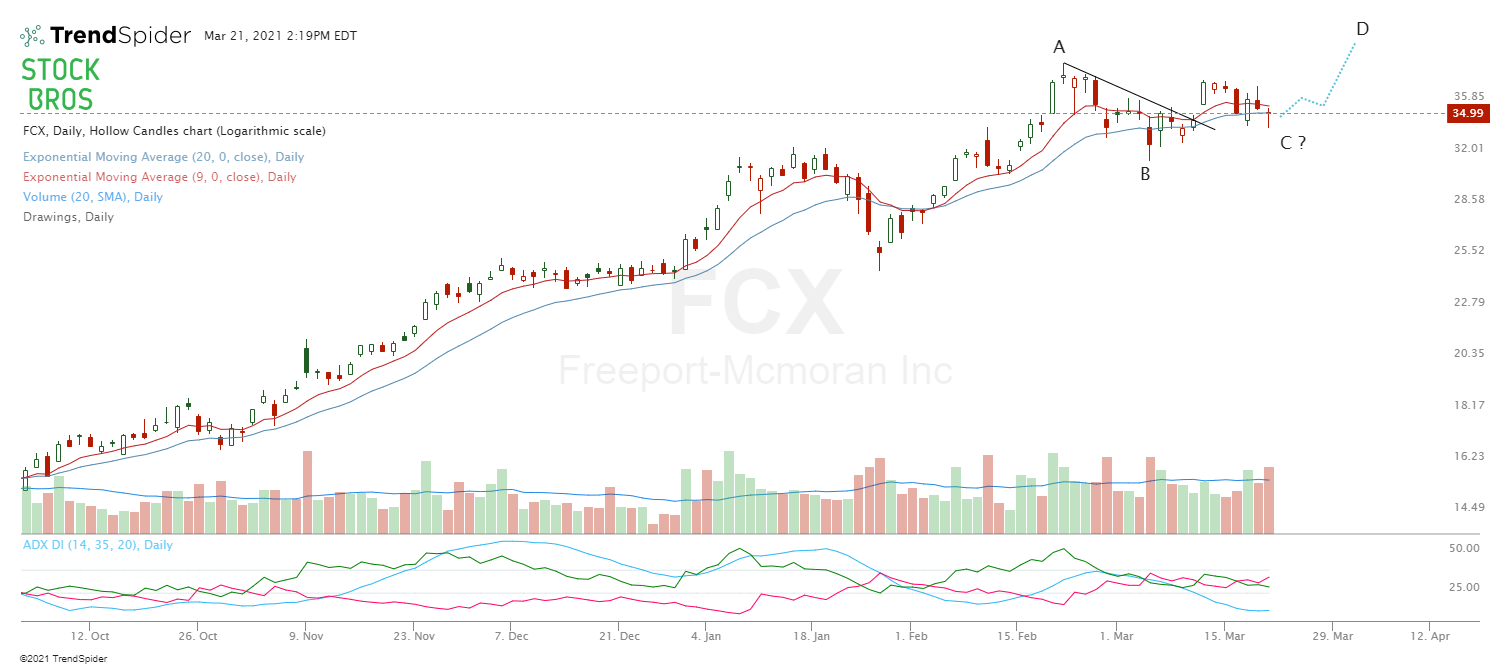 3. Rent-A-Center (RCII)Trending nicely off the 20 EMA. Looks like it's bouncing off it again. If it breaks Friday's high of $61.71, it would be a good long with a stop loss under Friday's low. Target would be a new swing high to around $69-70. 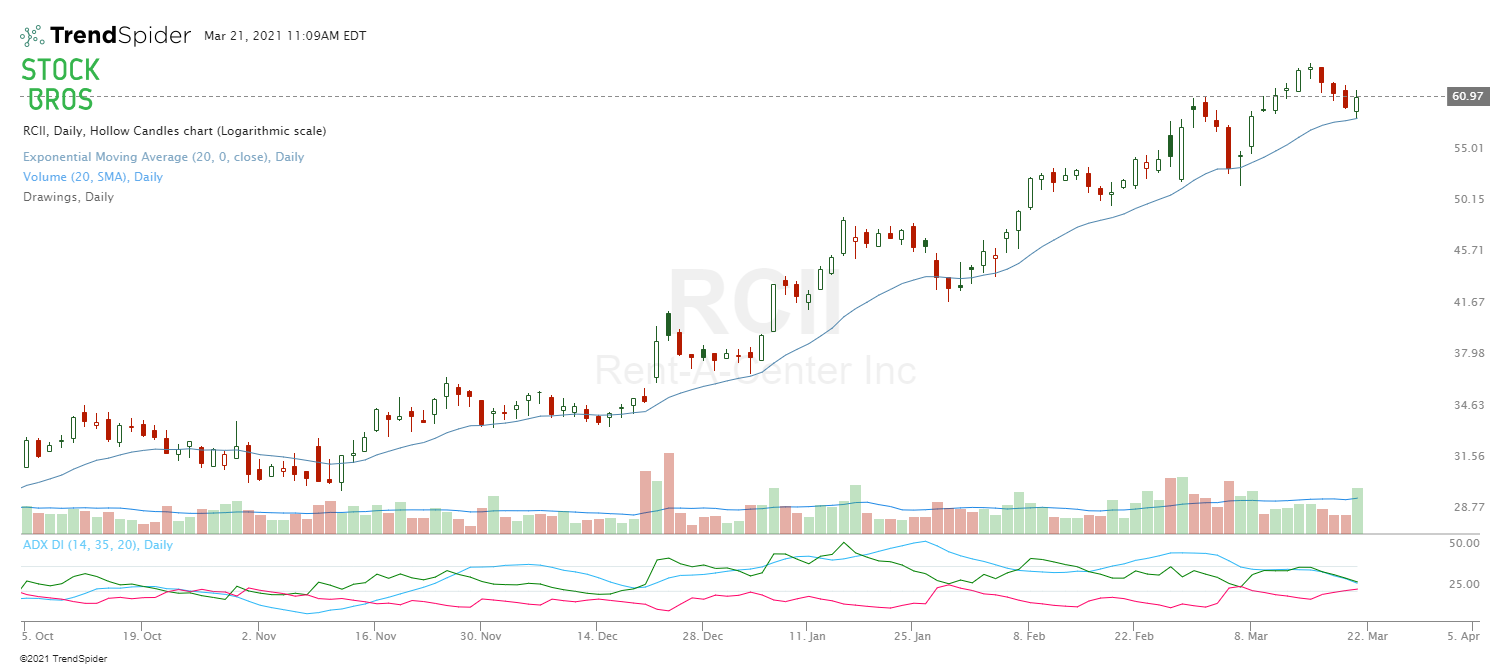 4. Discovery Inc. (DISCA)Same old story from past watch lists, the gift that keeps on giving. Buy near 9 EMA until the trend eventually breaks. Although the higher it keeps going, the riskier it becomes. 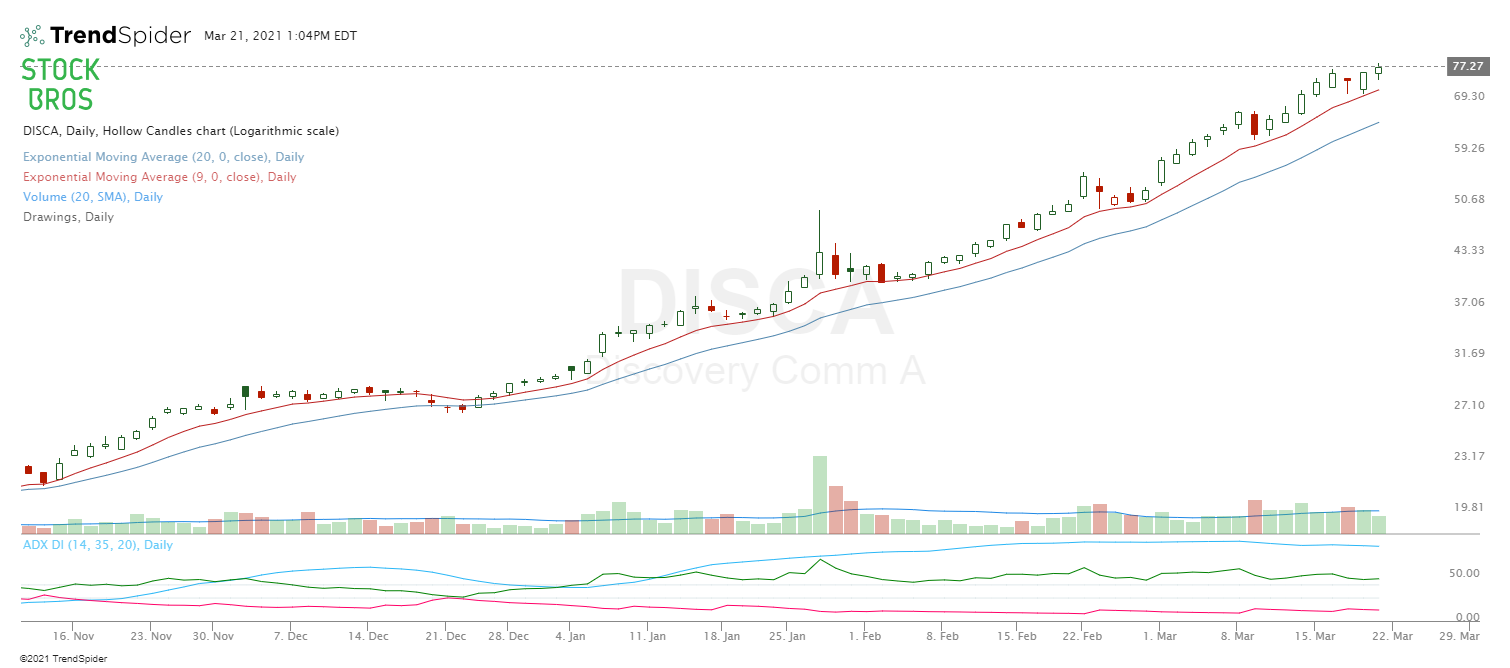 5. Vipshop Holdings (VIPS)Good setup from last weeks' watchlist where we wrote: "In this recent runup, VIPS keeps printing these types of candles highlighted in the chart before running higher. Trending above 9 EMA, once that breaks, the trade could be over." Same idea as DISCA essentially. Ride the 9 EMA for now. 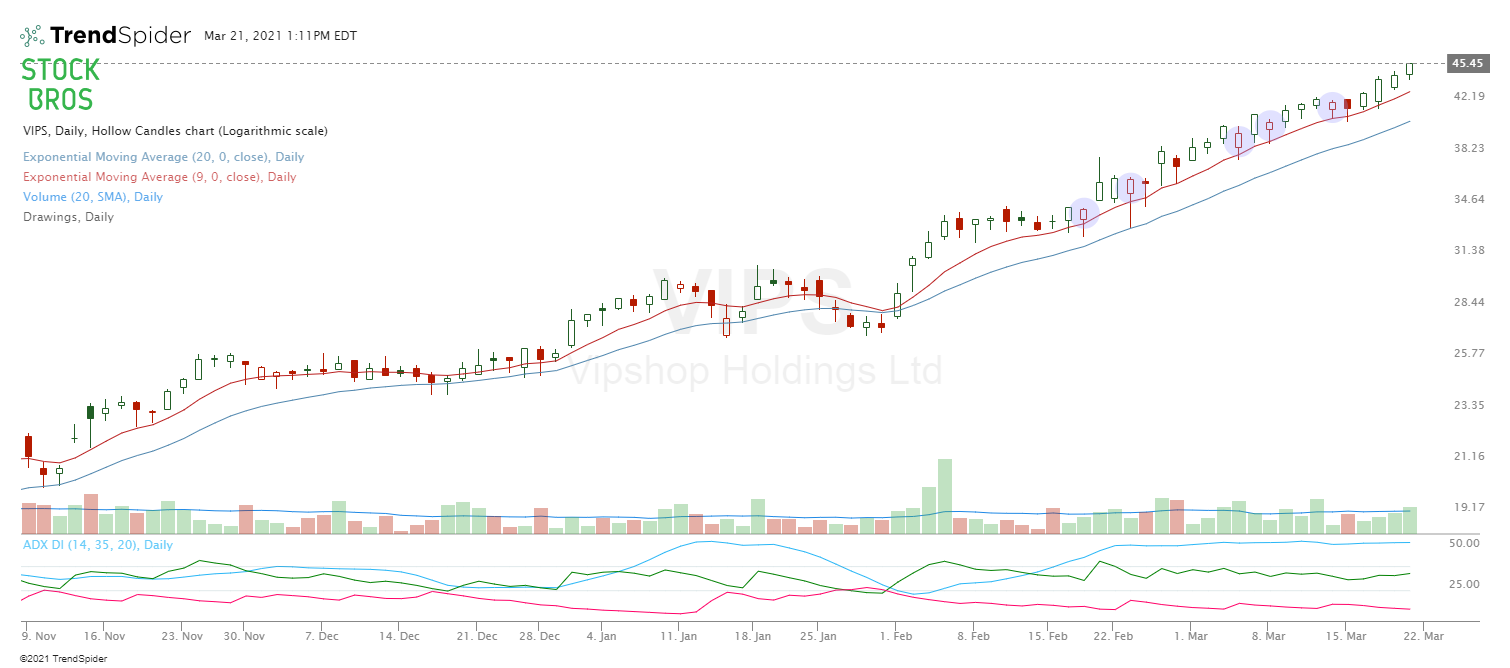 6. Magnachip Semi. (MX)Looking for a break of $22.50 (Friday's high) for a long. Volume patterns are bullish too. 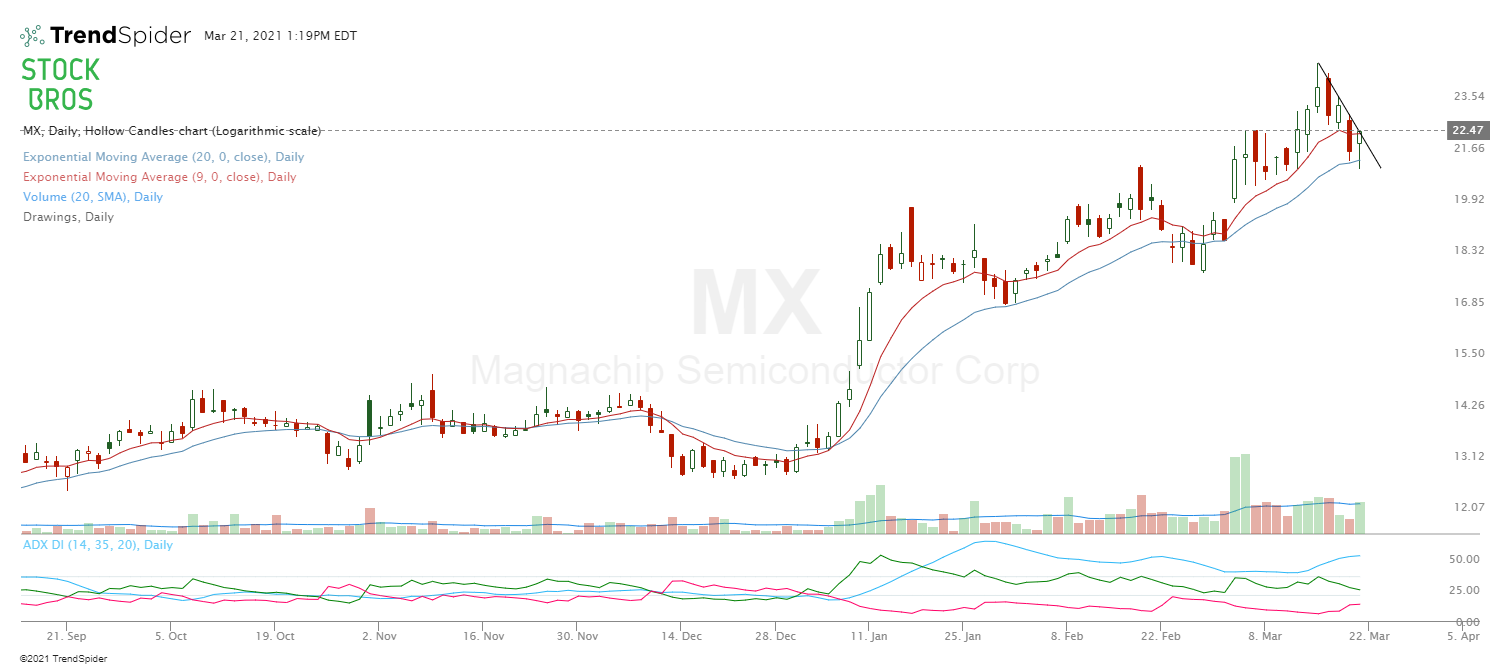 7. Kohl's Corp. (KSS)Balloon break out from last weeks' watch list. It pulled back and retested the breakout zone so it still looks bullish. Holding 20 EMA nicely. 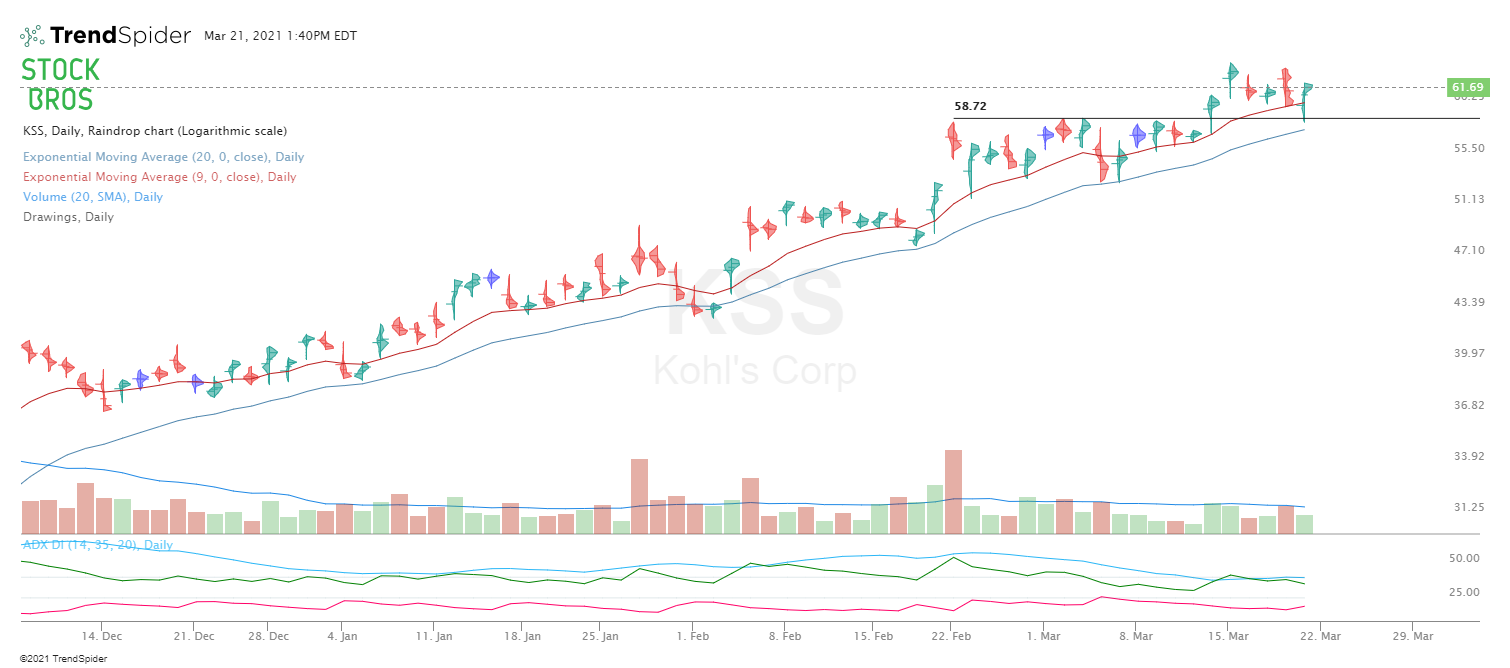 Here's a regular candlestick chart of KSS. Potential stop losses can be under $57.30 or under Friday's low. 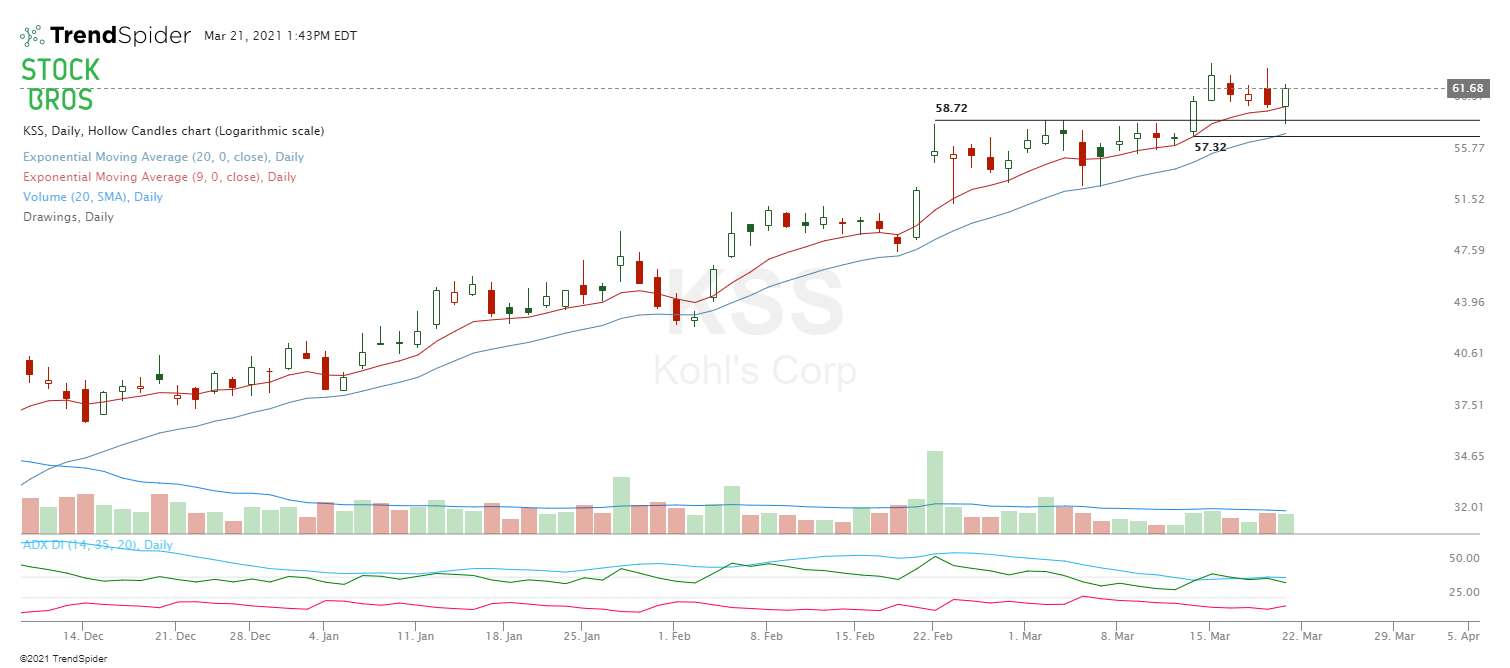 8. Finvolution (FINV)Nice runup after their earnings report and has been consolidating nicely ever since. The longer it can consolidate here, the better. Overall, looks bullish but it's a Chinese stock so there's that risk. 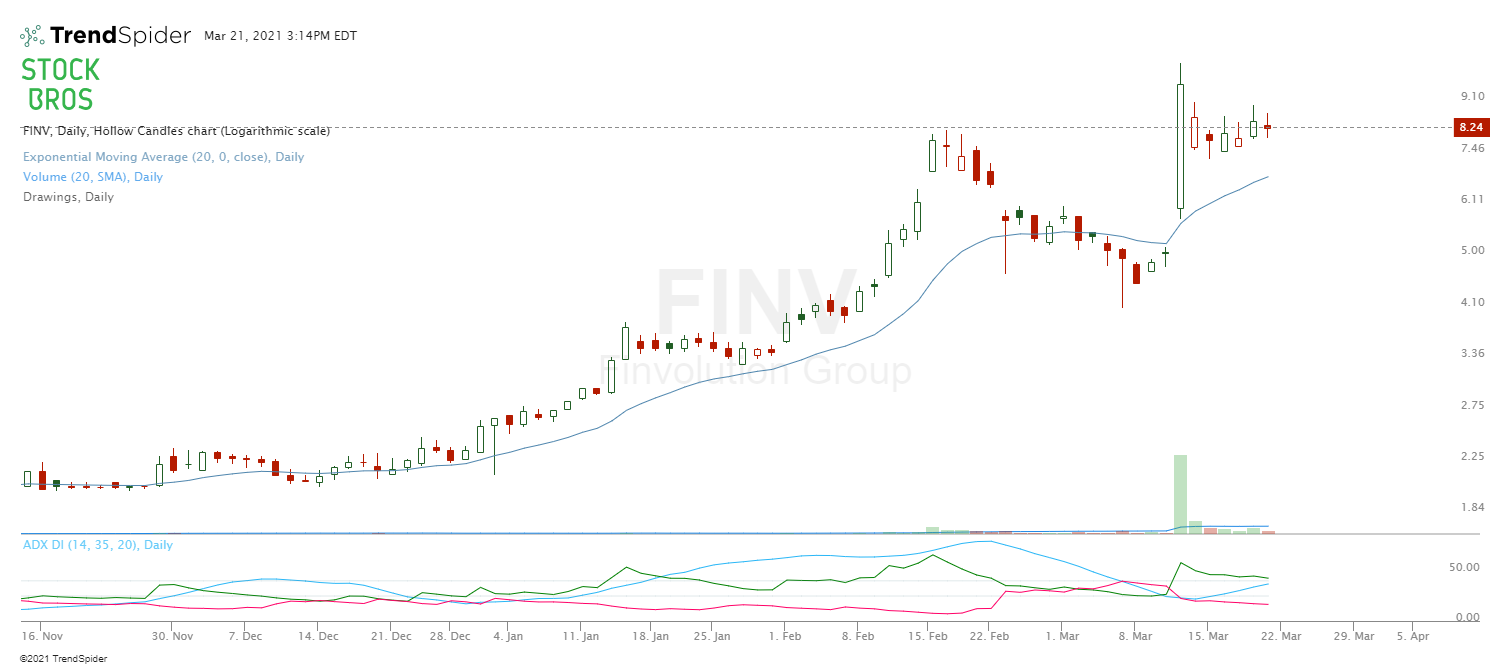 9. Facebook (FB)Weekly timeframe break out. Trend is higher so look for dips/consolidation periods on daily 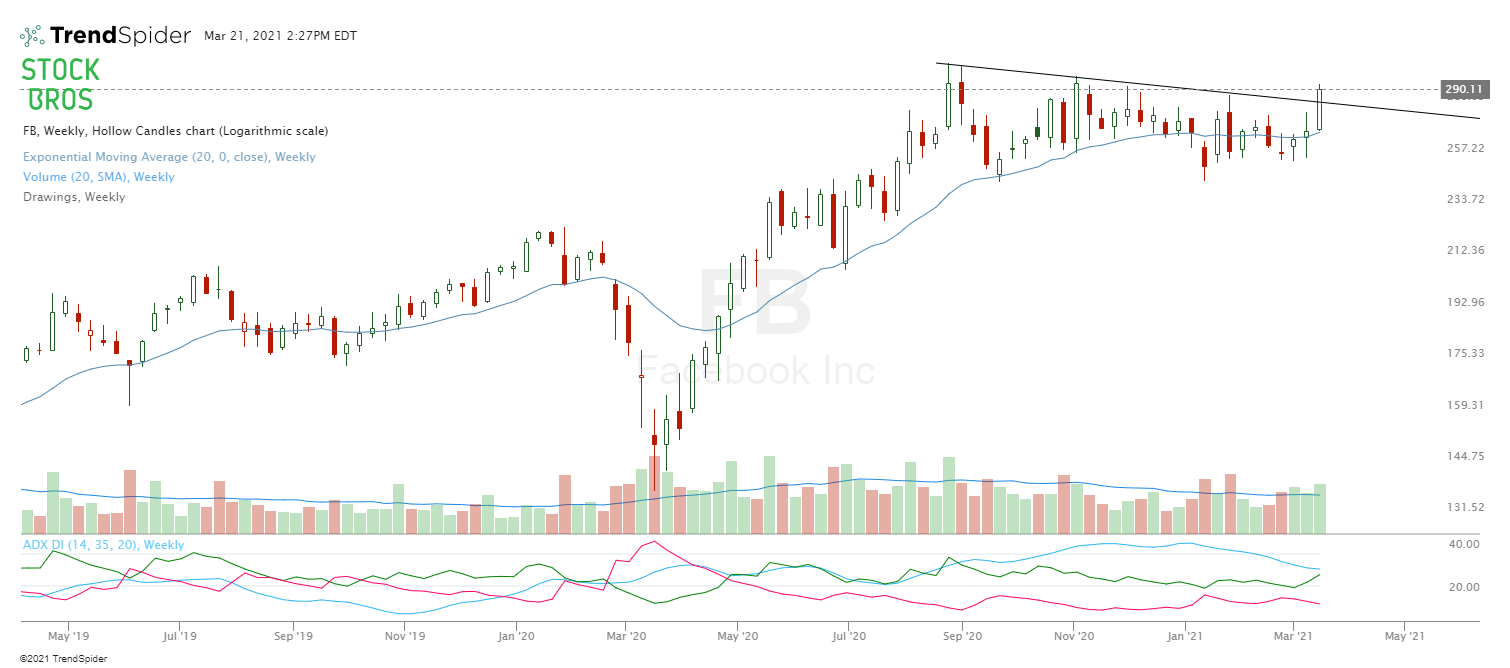 10. Shopify (SHOP)SHOP looks a bit heavy here. A close under $1098 could be bearish that can see it retest recent lows around $1030. 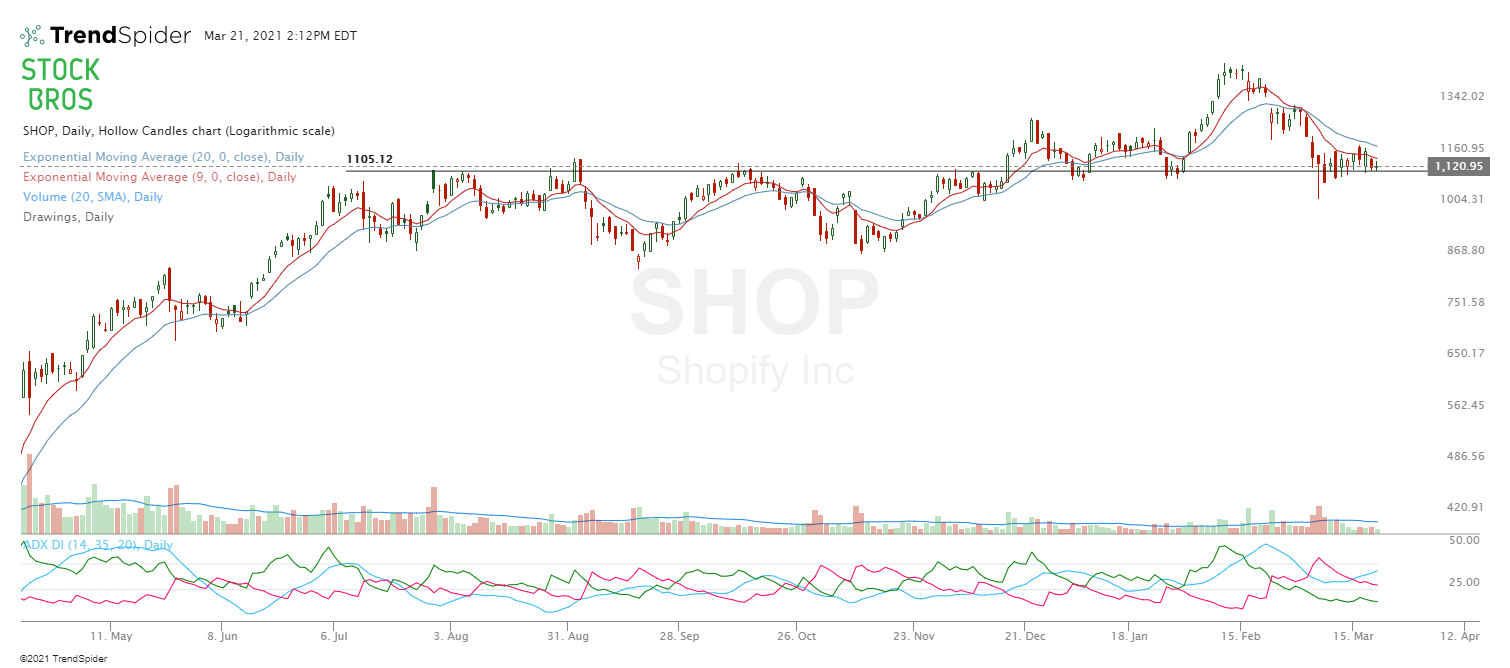 11. Kirkland Lake Gold (KL)Chart is still overall bearish. Using that $35.50 level as a guideline for stop loss. 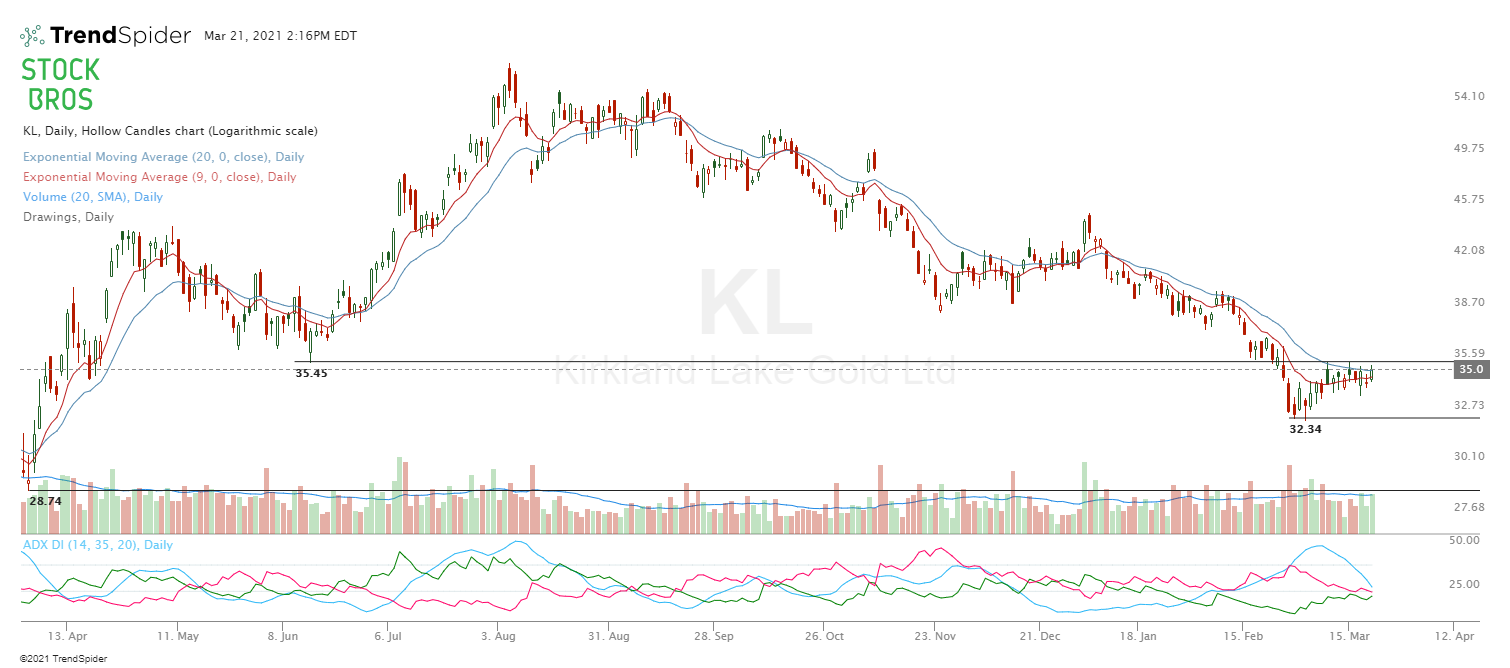 Need Chart Software?TrendSpider is a top-tier charting platform where traders can put their technical analysis skills to work. It offers automated technical analysis tools, dynamic price alerts, back testing, 1-on-1 training sessions for those who need extra help, and more. A very unique tool that TrendSpider has is Raindrop Charts, which can give you a great edge with your trading. Get 10% off by clicking here & using the coupon code TS10 when signing up. You can also sign up for a 7-day free trial risk free.  Related Category Related Articles
Thanks for reading! If you enjoyed this article, please consider following us on twitter @StockBrosTrades and/or subscribing to our free newsletter to get articles like this sent to you when they are posted.
|
 Categories
All
Archives
September 2022
|

 RSS Feed