 Here's this weeks' watch list. The stocks to watch are: UA, JMIA, RJF, LLY, MAR, KSS, VIPS, LMT, DISCA, BB, TCNFF, KL, QTRX, and SD. Note: If any charts are too small to see, you can click on them to see the full image. 1. Under Armour (UA)Here's the weekly chart for UA. It's currently building a base above $18, and has multi-year resistance around $19.70. A break of resistance can send it over $21-21.50. 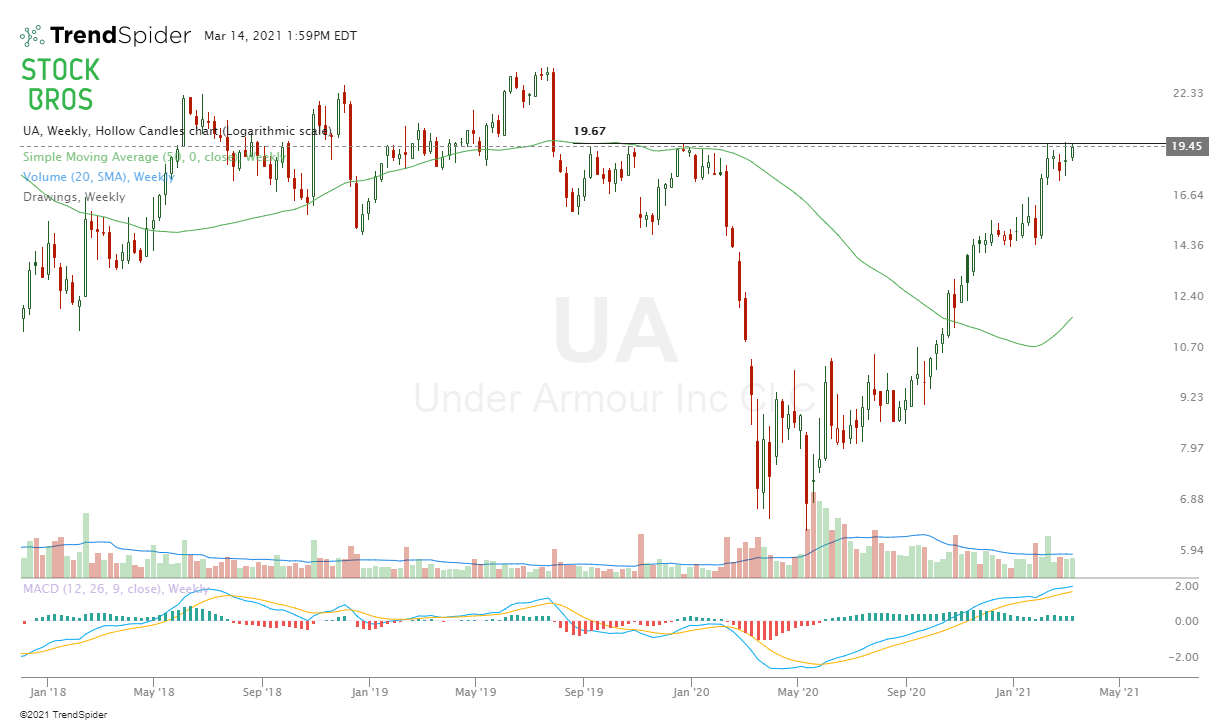 Here's the daily chart for reference. A few more days/weeks building a base around here can prove to be very strong for a break out. 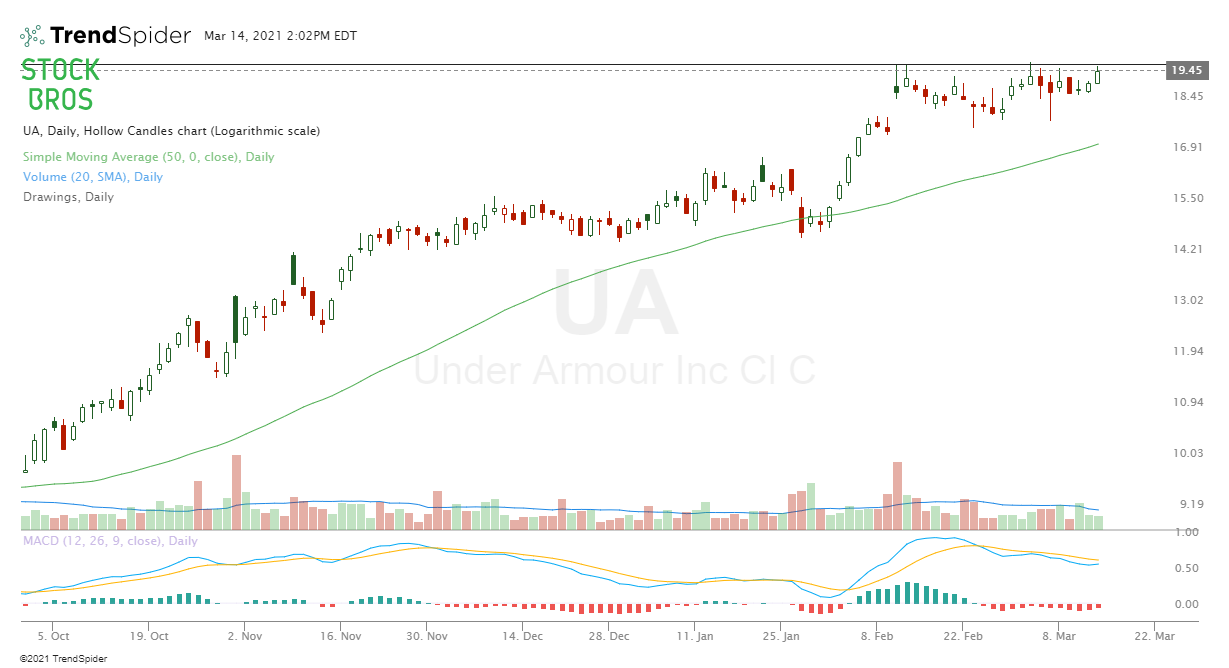 2. Jumia Tech. (JMIA)Inside candle on JMIA. $49.40 is a horizontal resistance and it is also 50 SMA resistance. If it breaks over that, the MACD will likely cross over as well which will be another confirmation. The MACD crossover has worked well in the past with JMIA, providing solid returns (we backtested the MACD on this stock, so we aren't making this up). Read: How to Backtest a Stock Trading Strategy - No Coding Required 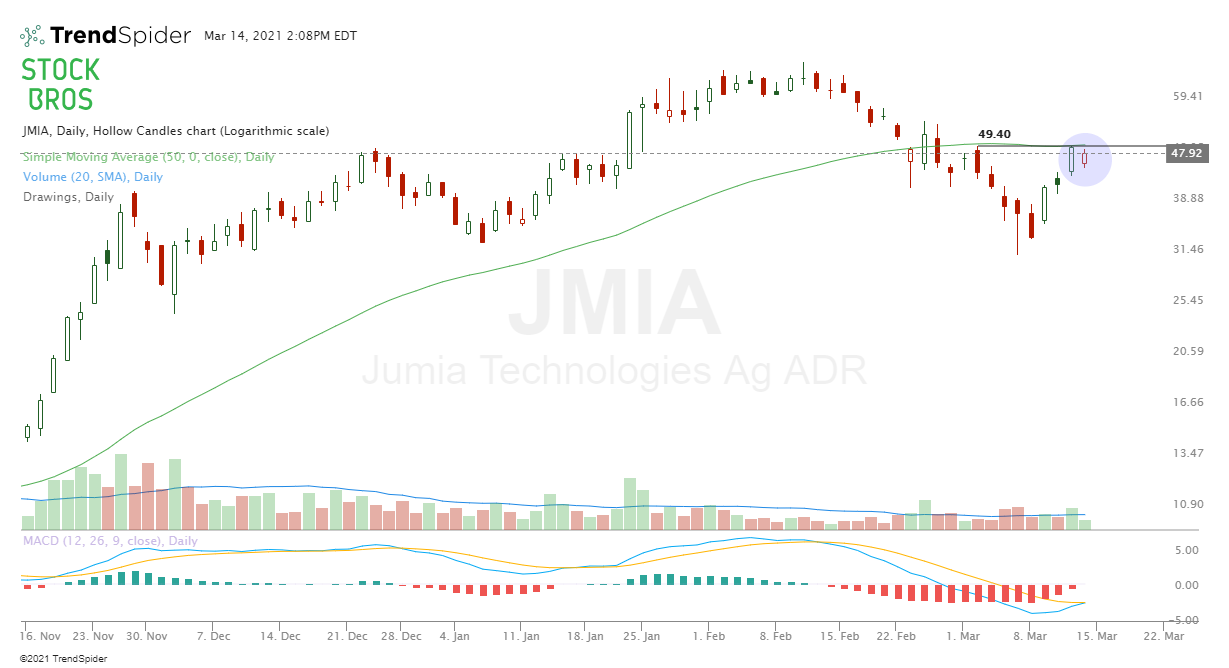 3. Raymond James Fin. (RJF)RJF bounced off the 20 EMA and looks bullish for now. Can easily go for another swing high. Wouldn't be interested if it closes under the 20 EMA. 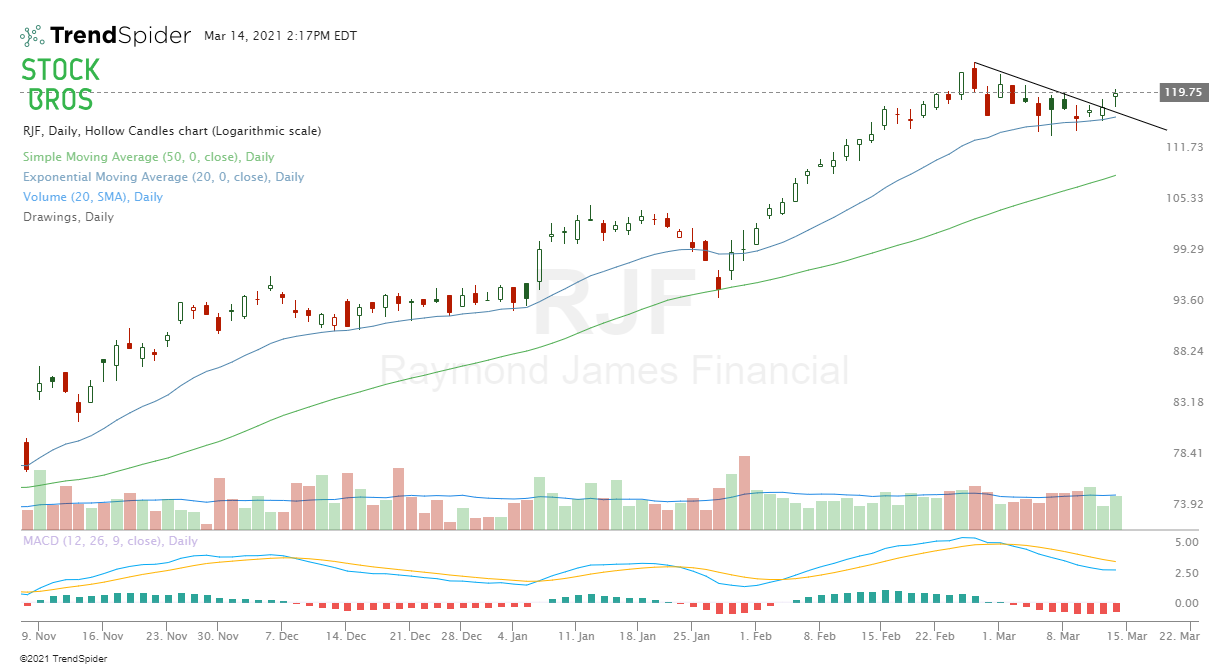 4. Eli Lilly and Co. (LLY)Still watching LLY (it was in our past watchlists). Hasn't been able to close above the resistance line we drew, but it's still a good buy near the bottom of the range or on a break out. 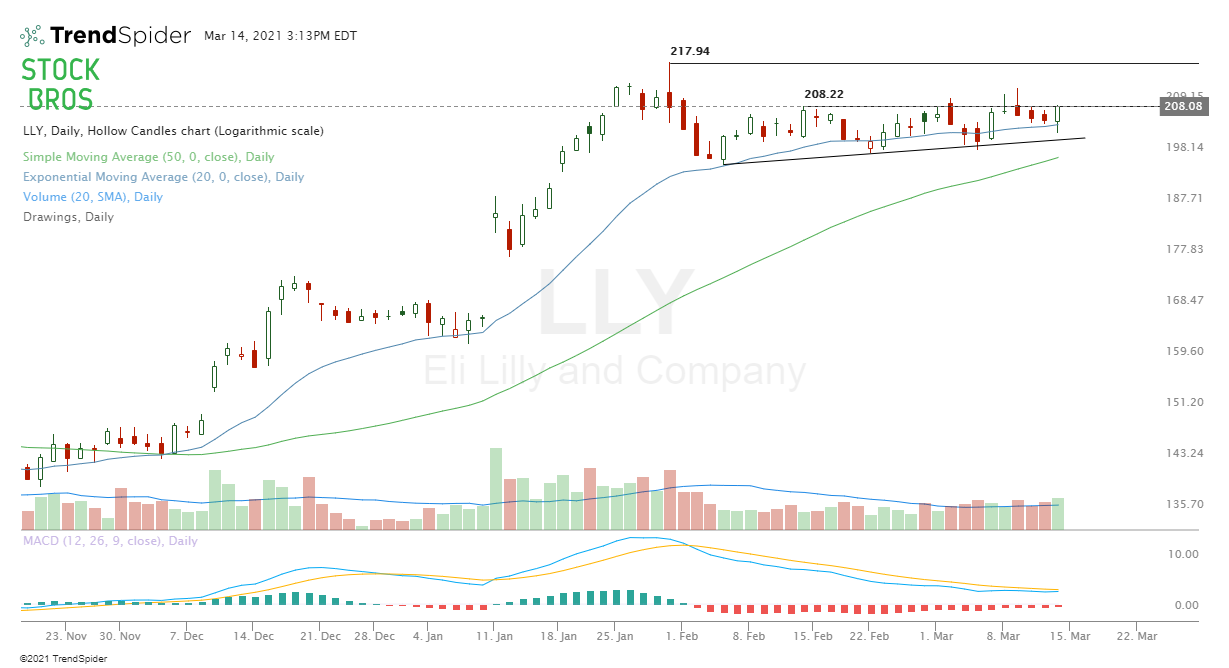 5. Marriot Intl. (MAR)After a nice runup, MAR pulled back and is still settling. Ideally a few more days/weeks of consolidation for a new swing high. 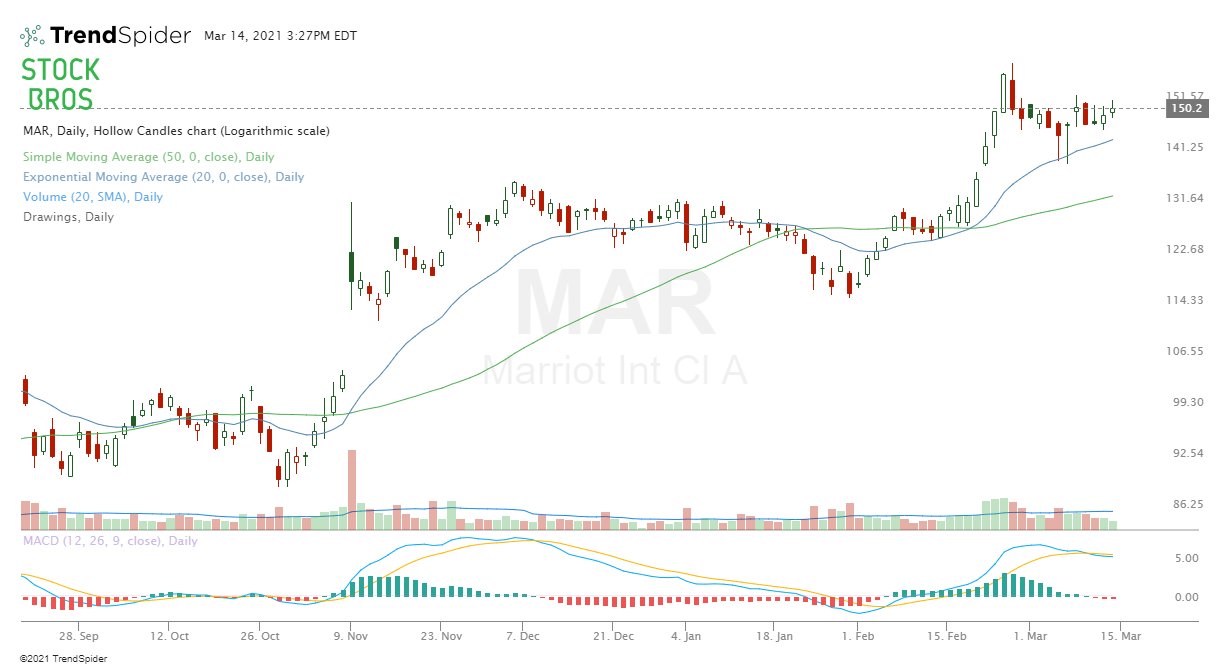 6. Kohl's (KSS)Nice balloon break out in KSS and it has been trending off the 20 EMA nicely. Ideally wouldn't want to see it break Friday's low if it pulls back but looks bullish for now. 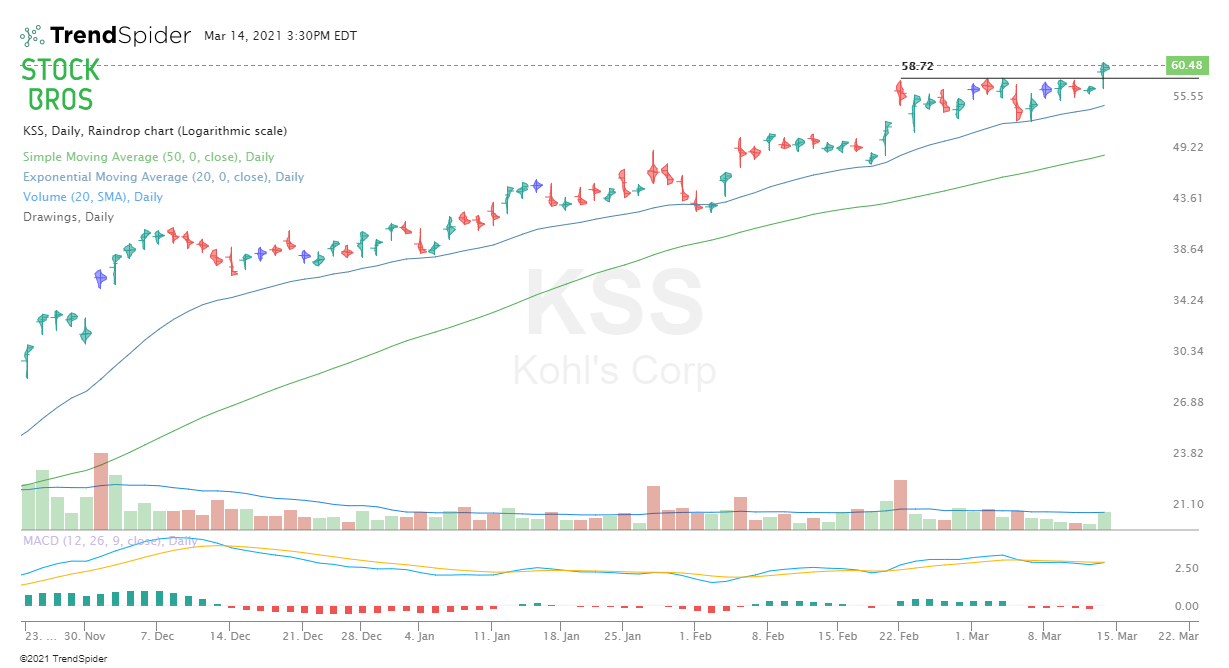 7. Vipshop Holdings (VIPS)In this recent runup, VIPS keeps printing these types of candles highlighted in the chart before running higher. Trending above 9 EMA, once that breaks, the trade could be over. 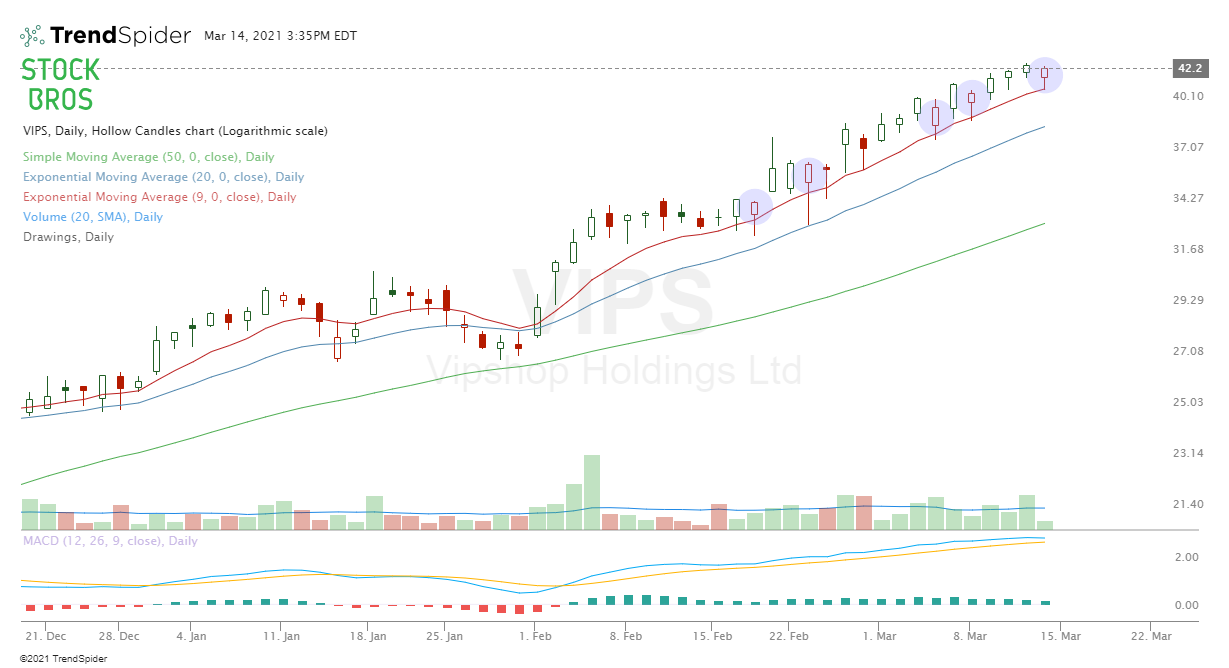 8. Lockheed Martin (LMT)Inverse head and shoulders on daily and bullish moving average crossover is very close to happening (20 EMA and 50 SMA). Looks decent for now, invalidated under $330. 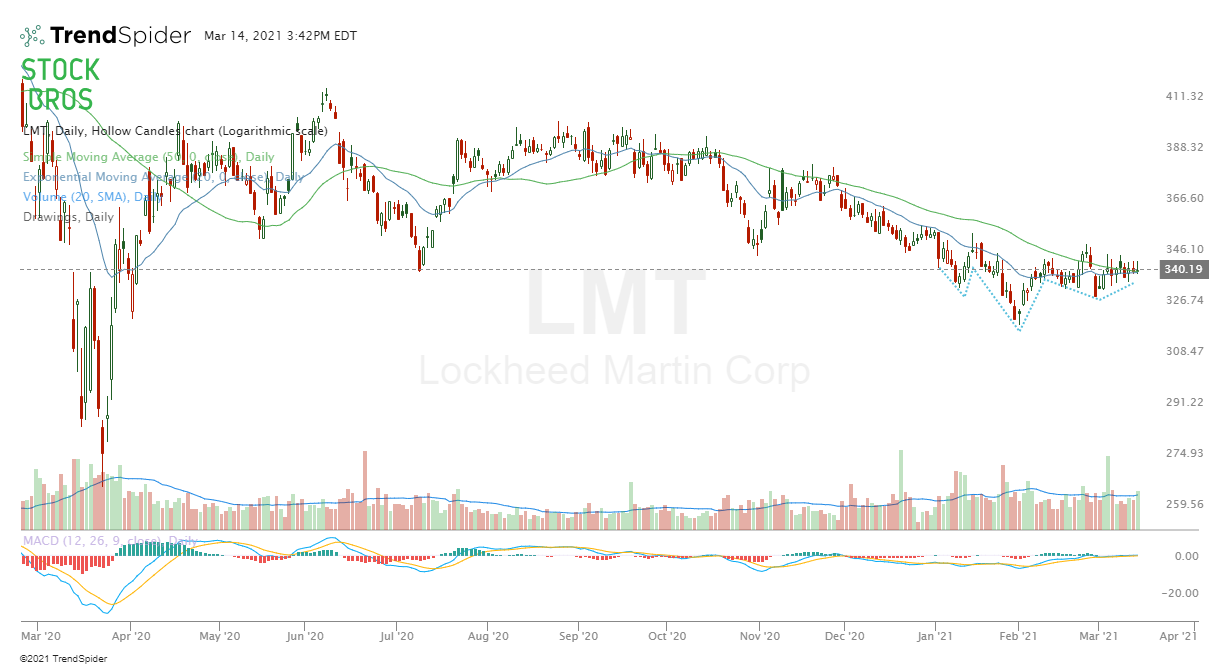 9. Discovery Inc. (DISCA)DISCA is still going. Still following the 9 EMA as guidance here. Once it closes under that, the trade would likely be done temporarily. 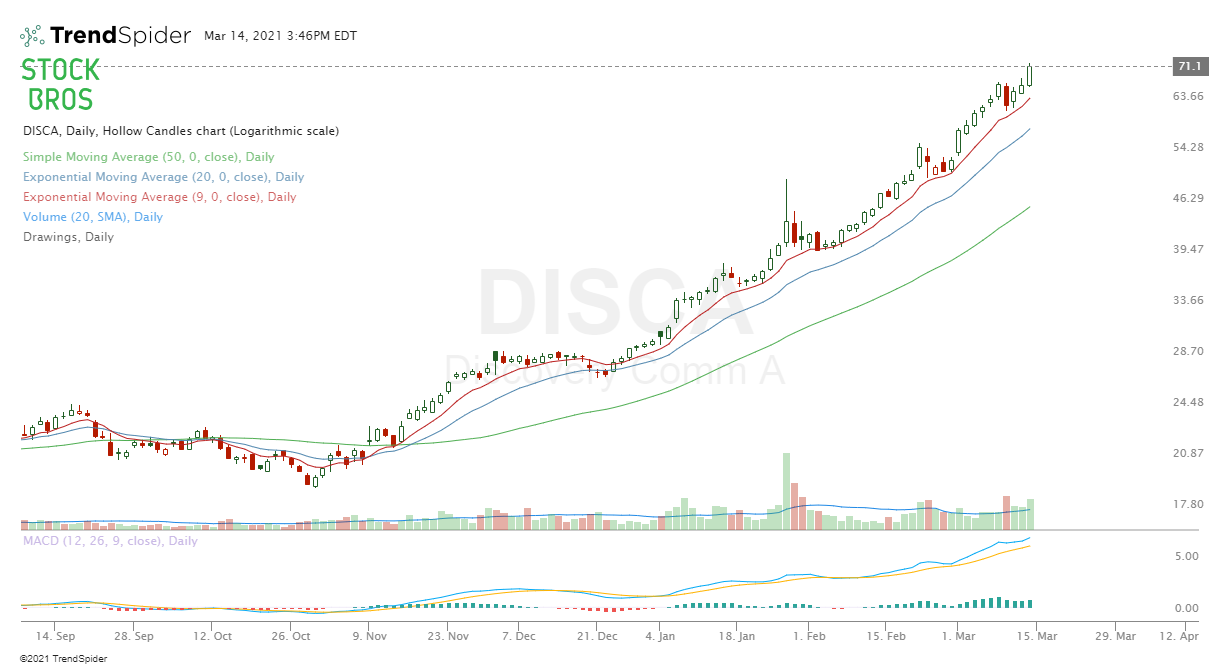 10. Blackberry (BB)Stimulus checks coming in, so we're watching the meme stocks. Blackberry in particular looks like it has some potential to run. Keep an eye on it. 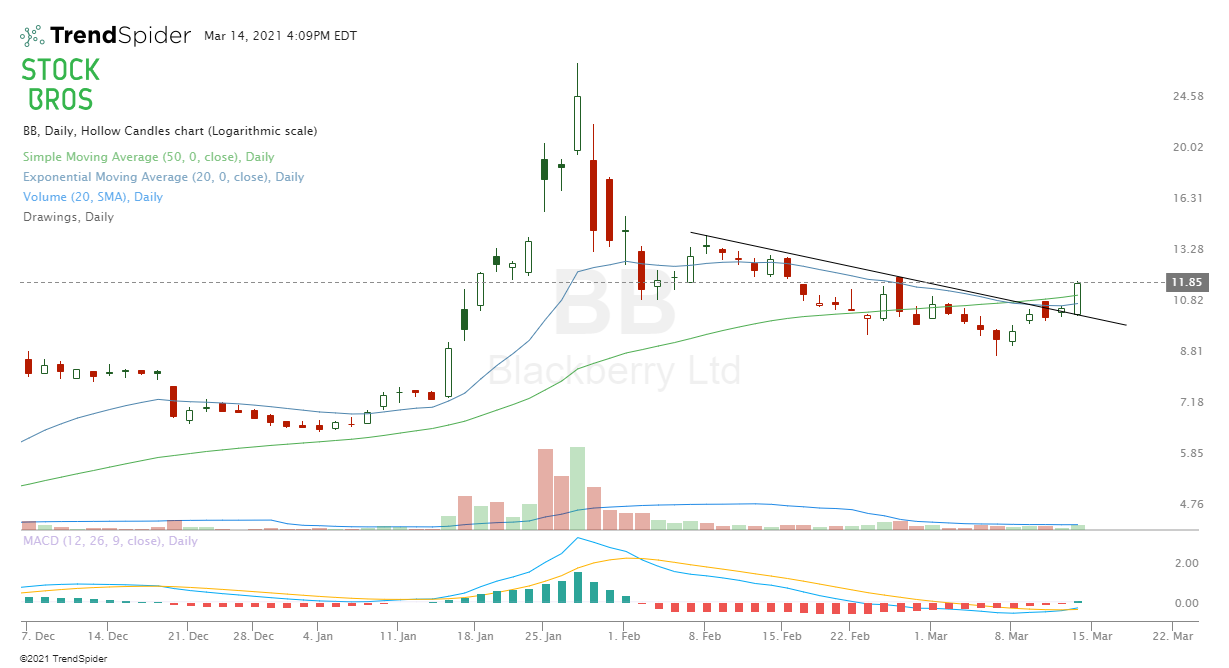 11. Trulieve Cannabis (TCNNF)Trulieve setting higher lows. Keeping an eye on it to see if it breaks out of $50.30 horizontal resistance. Would be nice to see it make one more dip (higher low) before running. 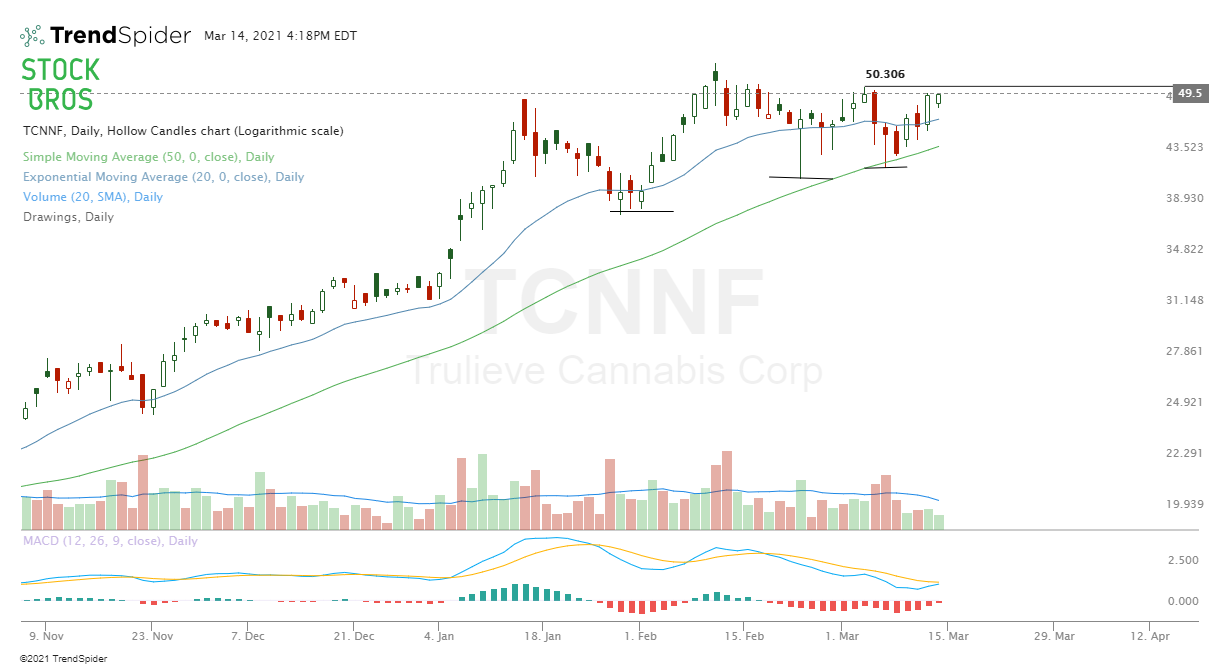 12. Kirkland Lake Gold (KL)Gold and gold stocks continue to be relatively weak. KL was unable to break through a previous support (now resistance). There's also a trend line resistance above. Overall, the chart doesn't look too great for KL despite being a solid company. Watch for it to start rolling over like it did in February. A close above $35.50 ish invalidates a short position. 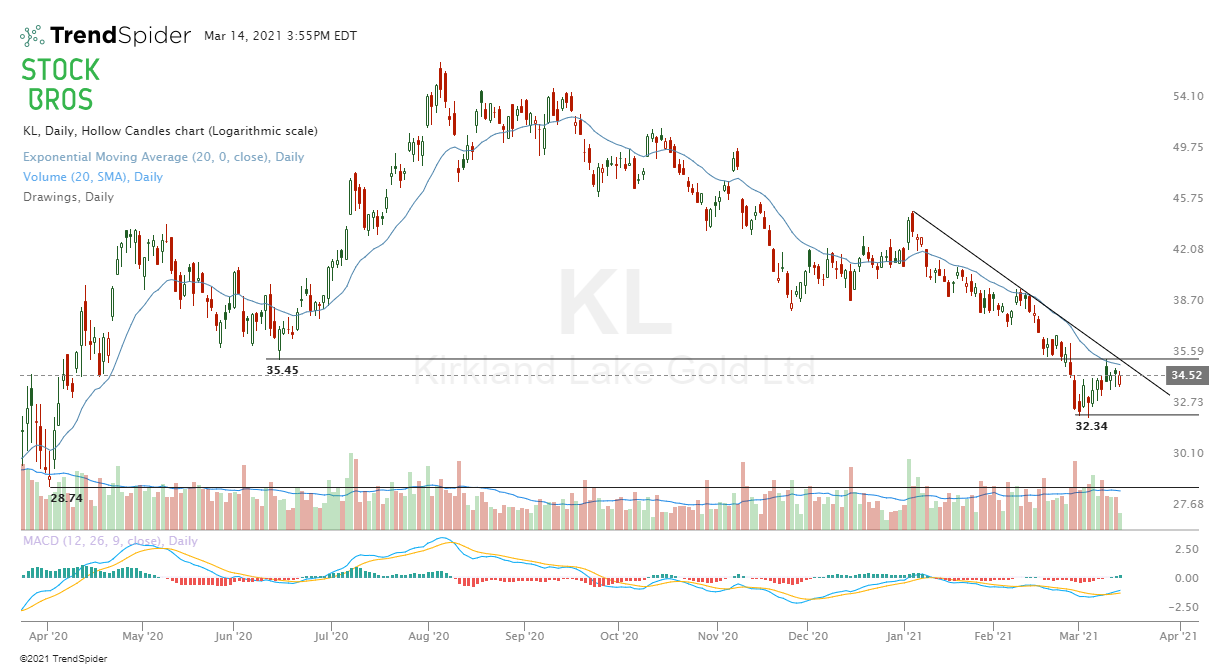 13. Quanterix Corp. (QTRX)QTRX made a lower low and is under the 50 MA so it's showing signs of weakness. Look for a breakdown of this short-term trendline this week. 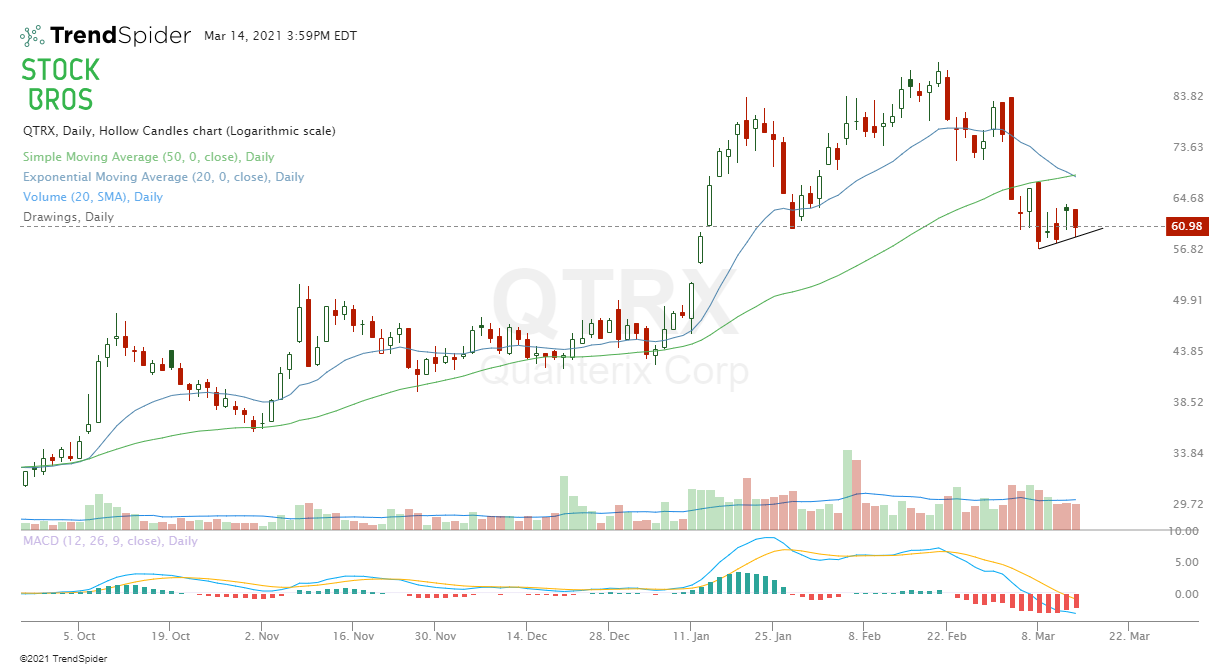 14. Sandridge Energy (SD)Very similar idea to the QTRX short idea above. Short thesis invalidated if closes above $4.80 as that's where previous support was. 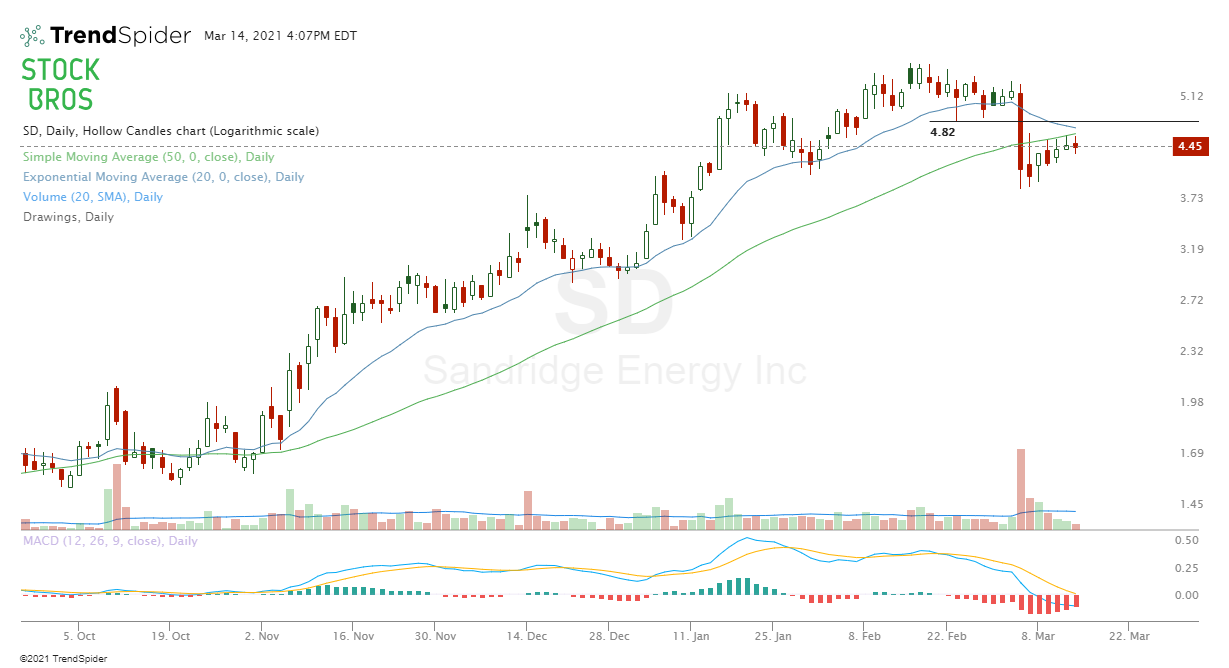 Need Chart Software?TrendSpider is a top-tier charting platform where traders can put their technical analysis skills to work. It offers automated technical analysis tools, dynamic price alerts, back testing, 1-on-1 training sessions for those who need extra help, and more. A very unique tool that TrendSpider has is Raindrop Charts, which can give you a great edge with your trading.  Get 10% off TrendSpider plans by clicking here & using the coupon code TS10 when signing up. Related Category Related Articles
Thanks for reading! If you enjoyed this article, please consider following us on twitter @StockBrosTrades and/or subscribing to our free newsletter to get articles like this sent to you when they are posted
|
 Categories
All
Archives
September 2022
|


 RSS Feed