 Here's our weekly stock watch list. The stocks to watch this week are: ANGO, APPS, CTB, SKLZ, Z, LLY, VRNT, PLAY, DISCA, FUTU, NET, JCI, PLTR, AQUA, FB, APD, and CRECF (CRE.V on the TSXV exchange). Note: If any charts are too small to see, you can click on them to see the full image. 1. Angiodynamics (ANGO)Long from $20.50. ANGO has held strong during last weeks' market sell off and is now curling higher off the 20 EMA. Expecting a retest of highs and most likely new highs. 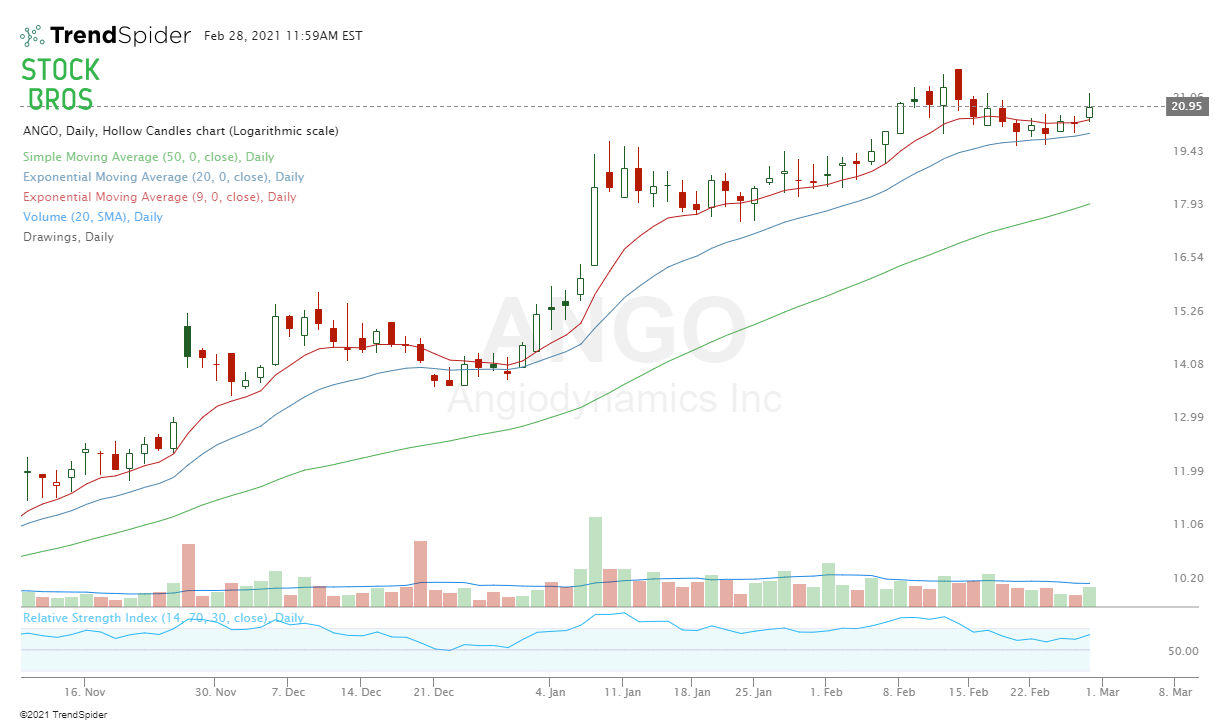 2. Digital Turbine (APPS)Currently at an area of confluence right at 2 resistance points. Overall, the trend is up and there's a volume shelf/MA support which can potentially help push it above resistance. Over that resistance can be a good long. 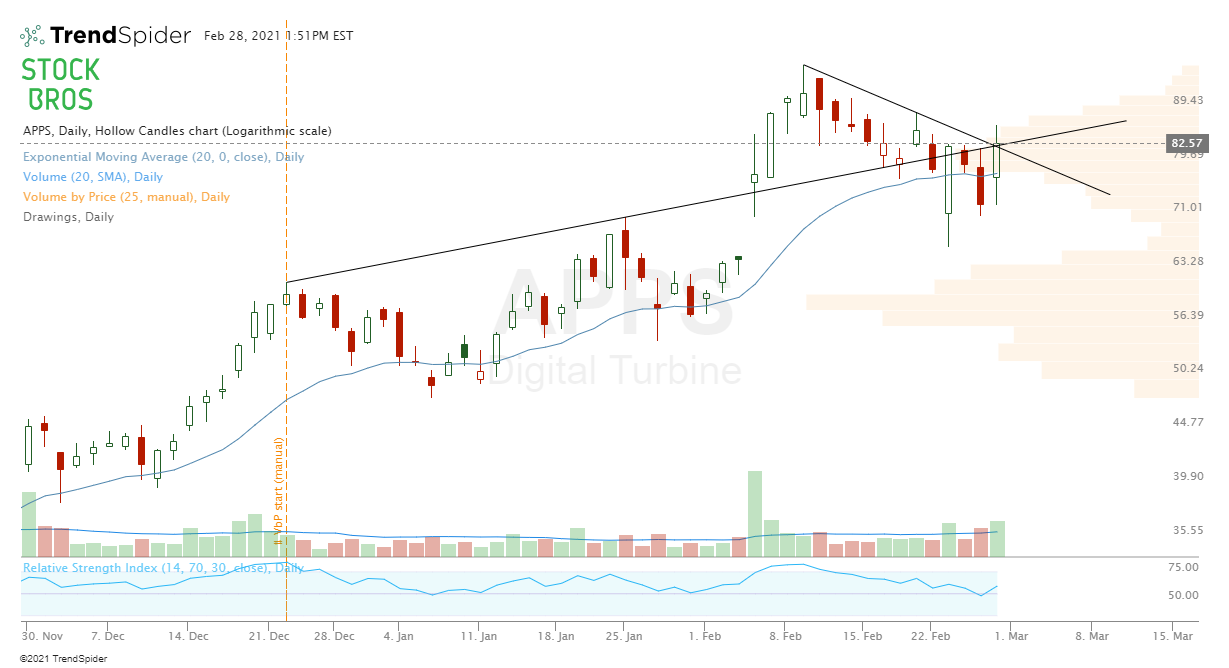 3. Cooper Tire & Rubber (CTB)65-minute time frame. CTB is consolidating strongly after a big gap up last week and the range is getting tighter. Would be interested in going long if it shows support near the low end of the range or after a break out. 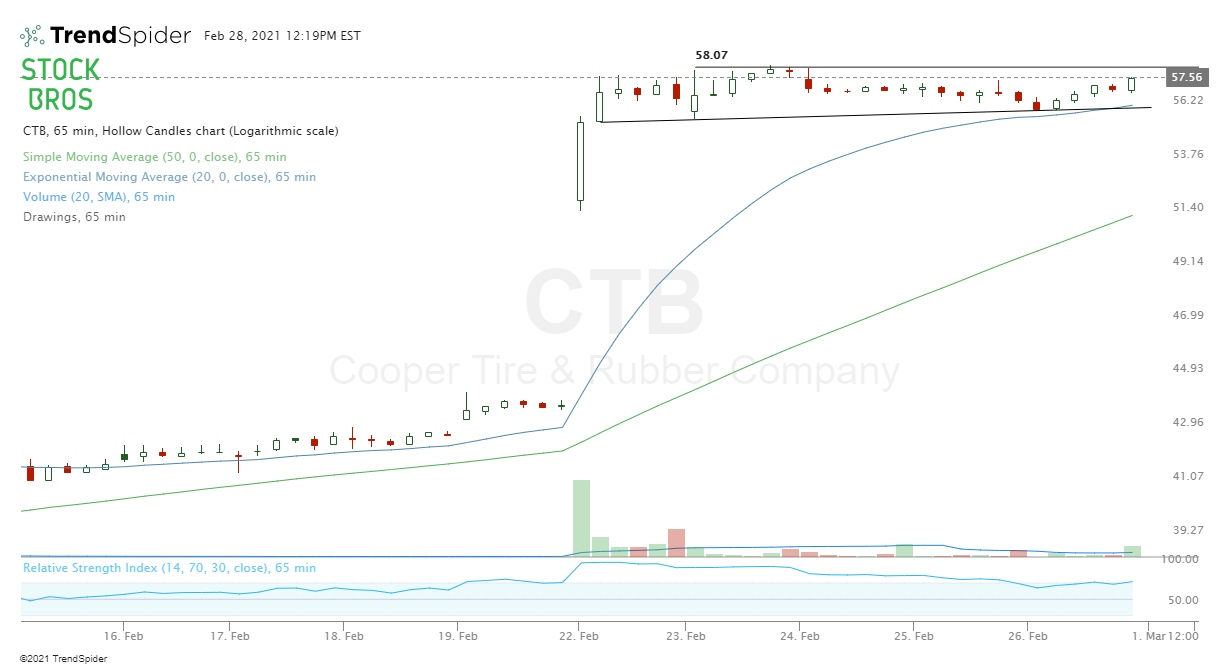 4. Skillz Inc. (SKLZ)The 3 week sell off in SKLZ was on relatively low volume compared to it's run up so that's a positive sign for bulls. It stopped at around $33.75 when it tried to bounce last week, therefore that's a level to watch and so is the trend line resistance. Re-entered a small long position at $29 after selling at $42. 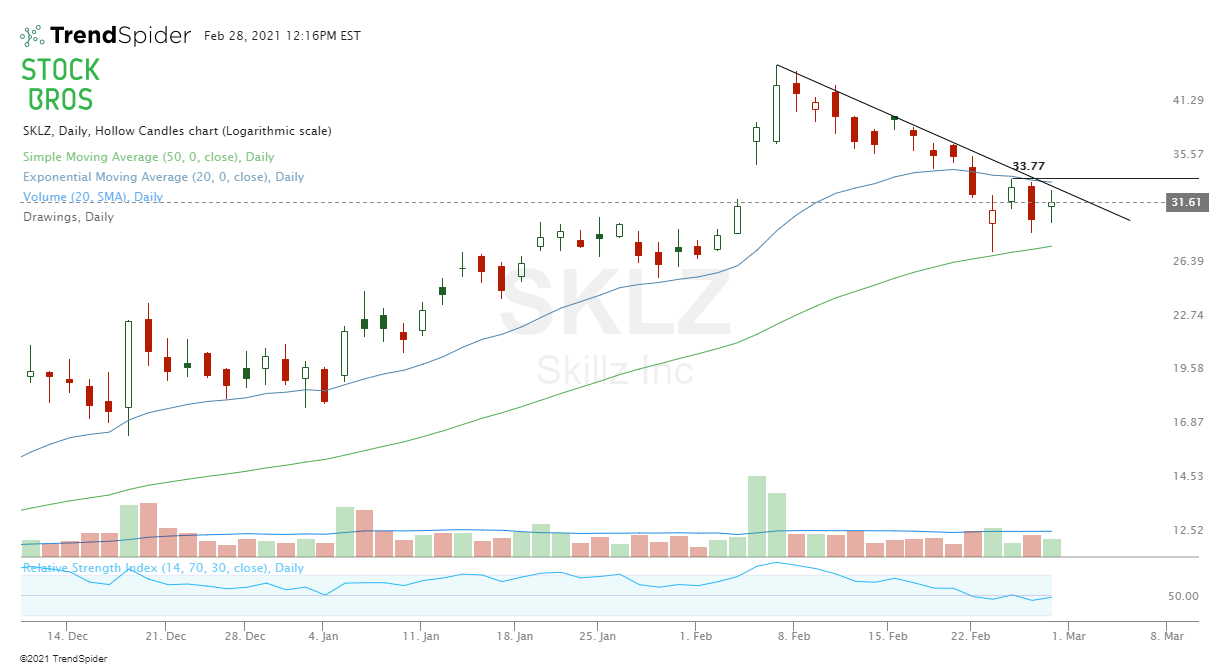 5. Zillow Group (Z)Retesting a previous resistance level around 152.60. Could be a low risk long, not interested if it closes under 50 SMA. A break above Thursday's red candle would be confirmation. 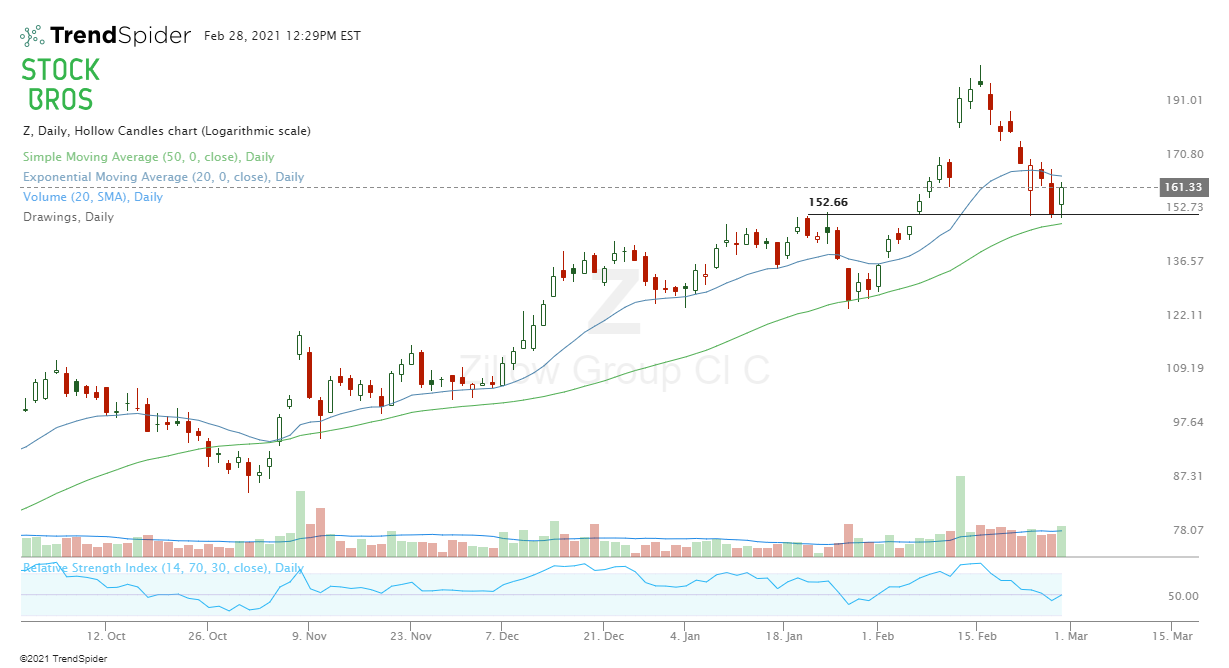 6. Eli Lilly & Co. (LLY)Break of $208.20 area has room to retest highs around $218. Volume shelf building up. Read: Stock Trading Strategy - How to Use Volume Analysis 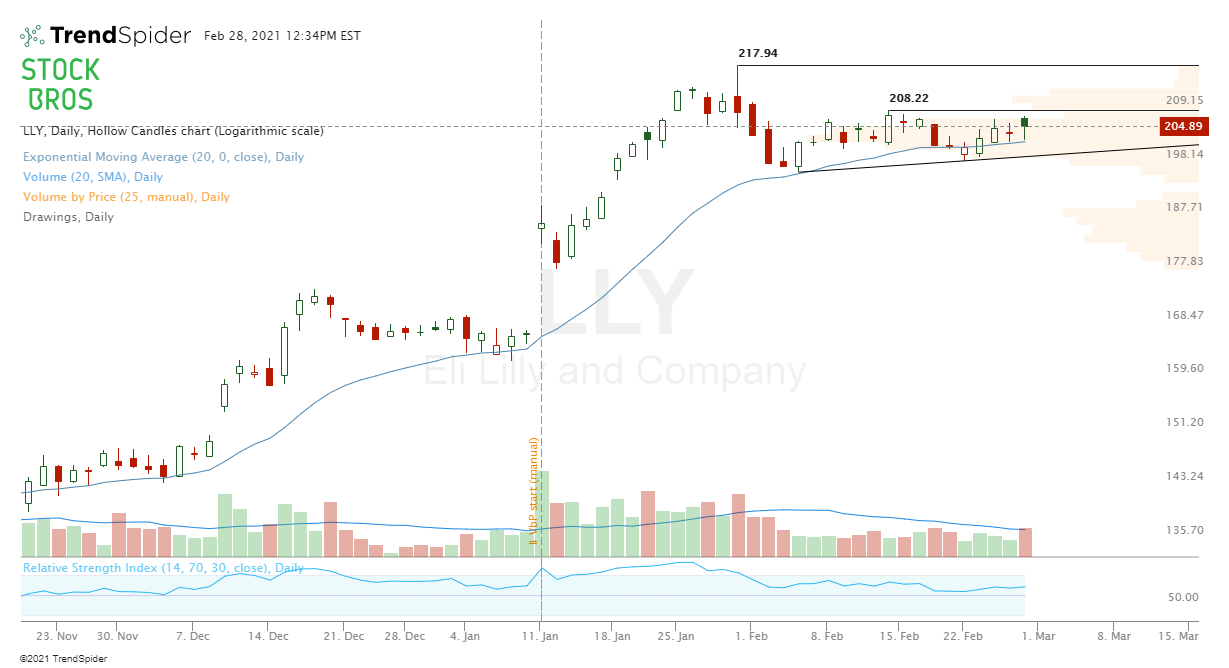 7. Verint Systems (VRNT)Trading in the gap up candle range. Buy at low end of range or on breakout. Not interested if it breaks under $47.60. 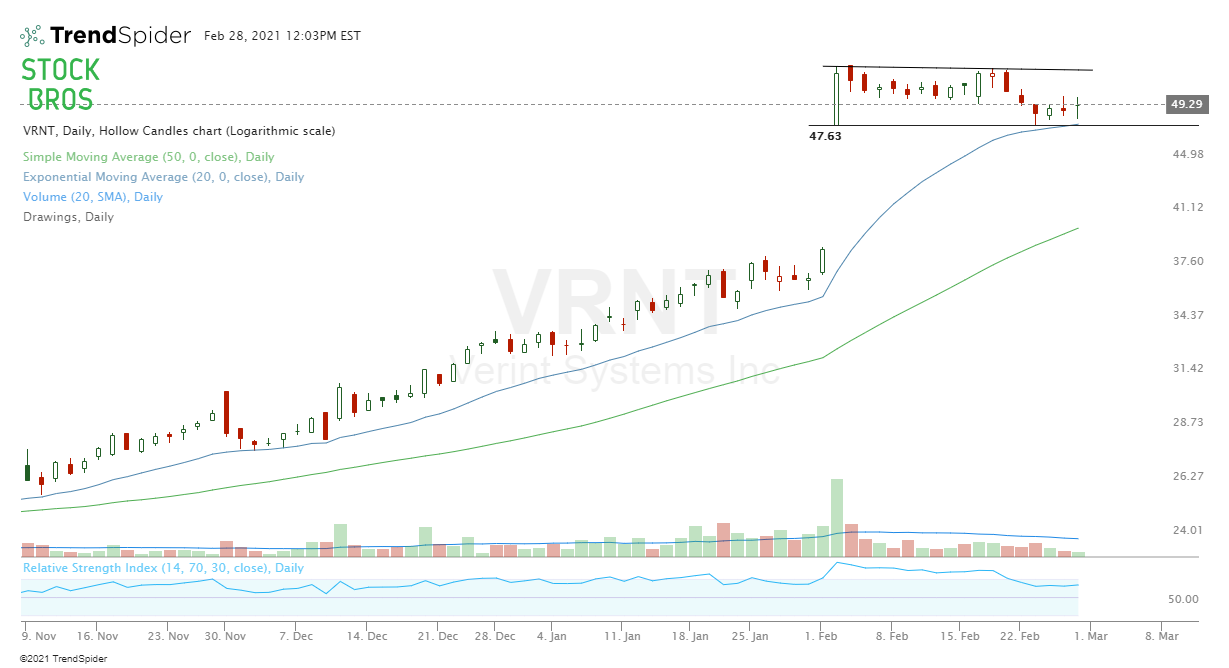 8. Dave & Busters (PLAY)Easy trend following it keeps bouncing off the 20 EMA. Buy near that area until it stops working. Read: How to Swing Trade Momentum Stocks 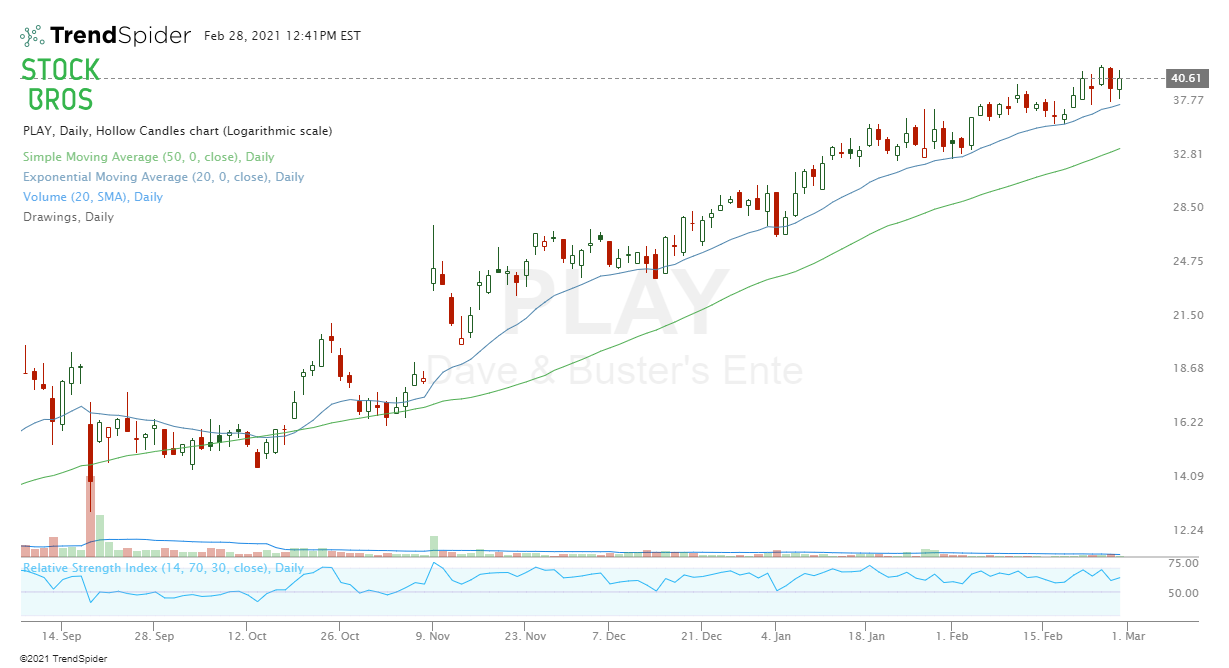 9. Discovery Inc. (DISCA)Same momentum strategy as above just that DISCA is working on the 9 EMA instead. Volume shelf building up too, still looks good. Initially took a long position around $43 from one of our previous watch lists. 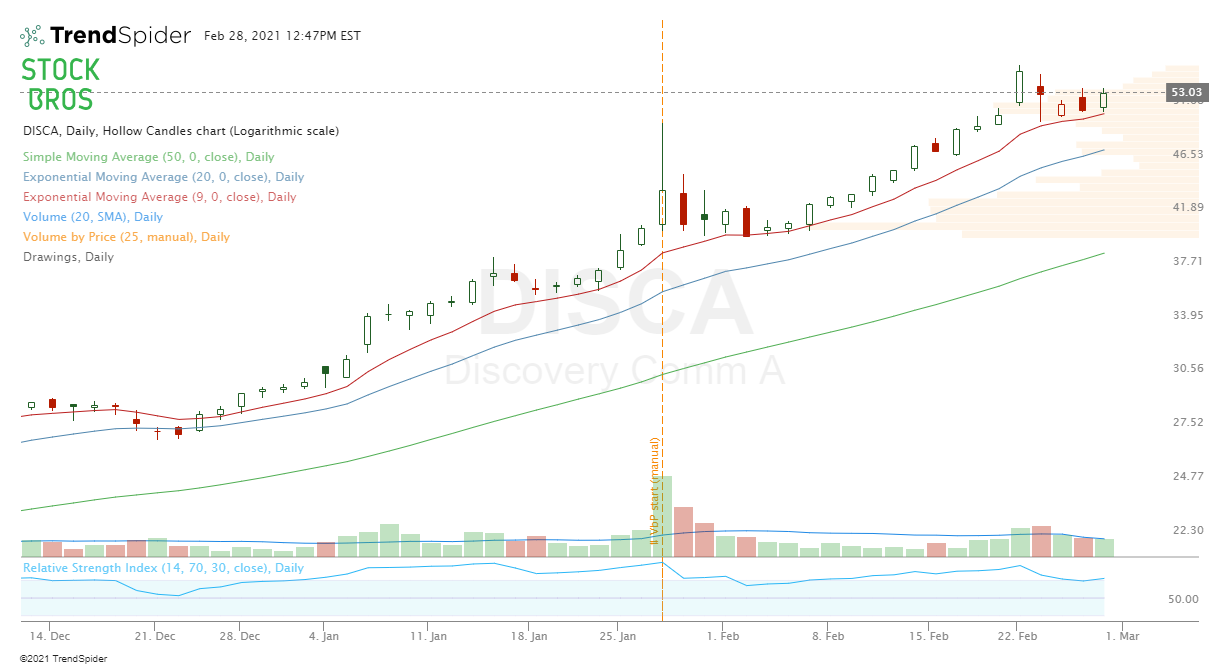 10. Futu Holdings (FUTU)If this can reclaim and close above the 9 EMA again, it can get bullish. Until then, not really interested but will keep it on watch. 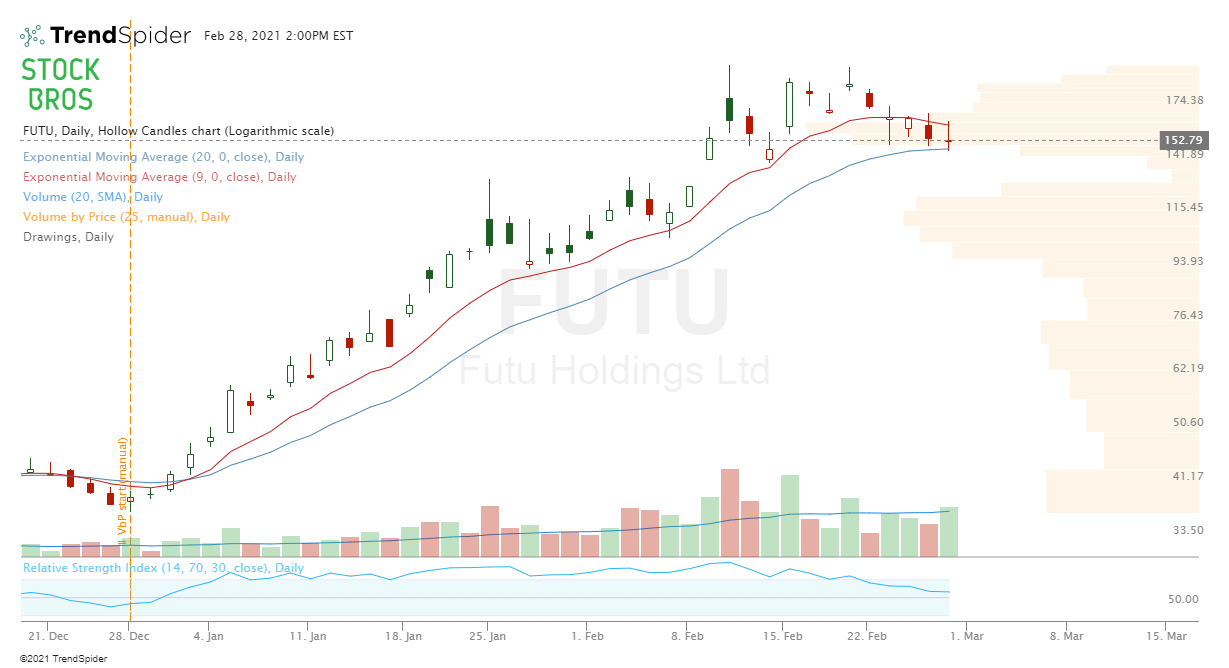 11. Cloudflare Inc. (NET)Short idea worked from last weeks' watch list, now it's sitting at support so we're just keeping an eye on it to see if it holds or not. No plans on taking a position yet. 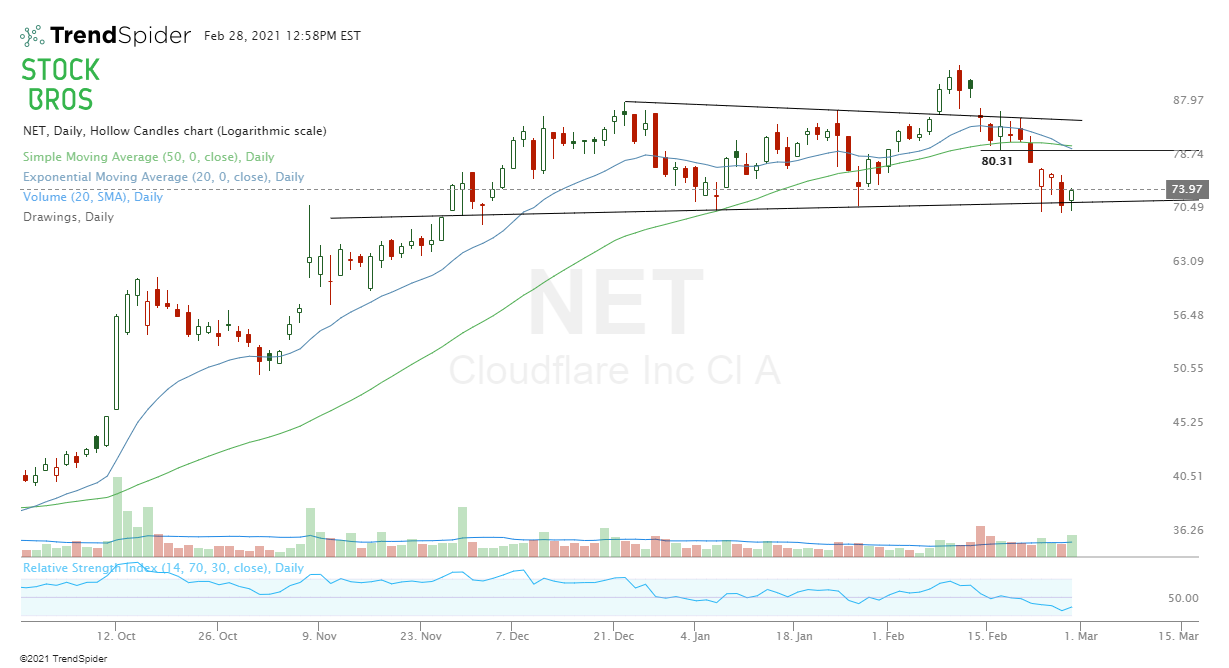 12. Johnson Controls (JCI)In a fairly predictable range right now so just trade the range, but overall the chart is bullish.  13. Palantir (PLTR)Don't like the way PLTR trades so most likely won't trade it but it is currently near 3 trend line levels as marked on the chart so it's one to watch.  14. Evoqua Water Tech. (AQUA)If this breaks the support trend line it can be a good short down to $23.50 and then $22.70.  15. Facebook (FB)Short idea from last week that played out nicely but there's still an opportunity. FB clearly has had a hard time getting past $267.60ish so that's an area to base a stop loss from. If it breaks $255 support, next support is $245.  16. Air Products and Chemicals (APD)Tweeted this short setup last Thursday which was then followed by a down day but there's still a chance to get in if it bounces a bit. $262 could be stop loss area, targets $250 and $246.  17. Critical Elements Corp (CRECF or CRE.V)Bullish chart with a nice bullish engulfing candle. The main ticker for this stock is CRE.V on the TSXV exchange so keep that in mind since the OTC version has less liquidity.  Here's the Canadian version of this stock, ticker CRE.V. All it has to do is break above this trend line resistance. Everything other indicator is pointing for a move higher. Read: How to Trade the Bullish or Bearish Engulfing Candle - Trading Strategy  Watch the Bond MarketLots of eyes are on the US 10-year treasury yield. If it spikes too rapidly, this will put stocks under pressure. Luckily (for bulls), yields are approaching a resistance point around the 1.50 level as you can see in the chart below. However, this Friday, there will be employment data. If this number comes out stronger than expected, rates can go up and cause the market to fall. So, don't forget to keep your eyes on this. 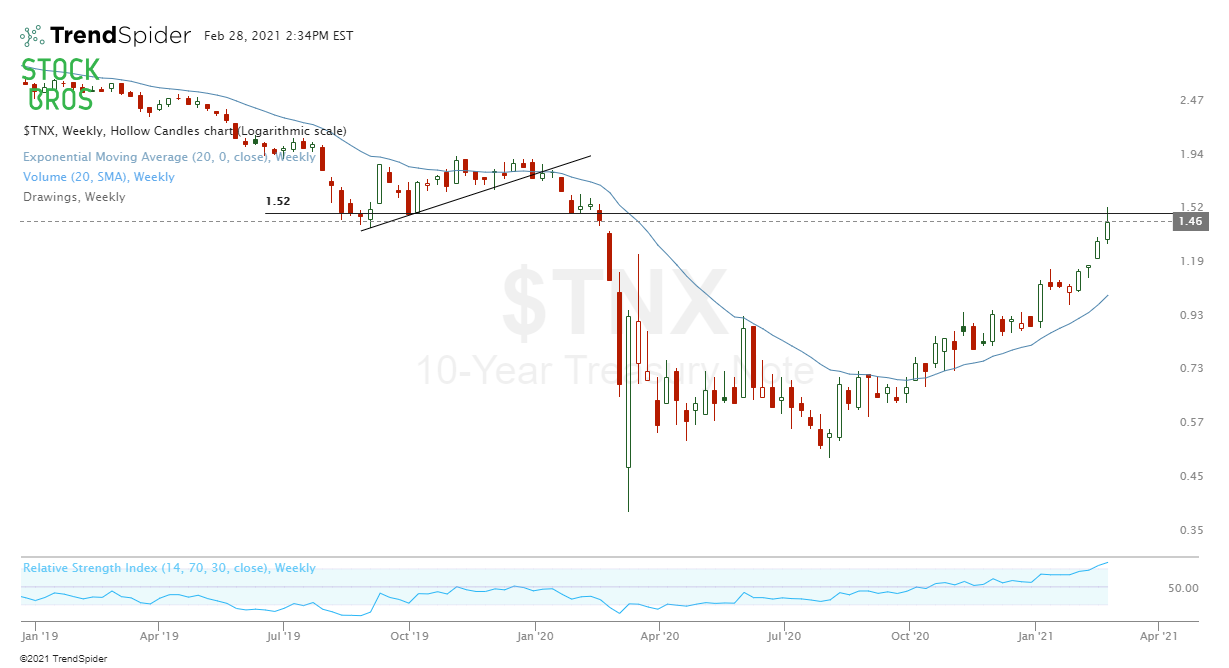 Need Chart Software?TrendSpider is a top-tier charting platform where traders can put their technical analysis skills to work. It offers automated technical analysis tools, dynamic price alerts, back testing, 1-on-1 training sessions for those who need extra help, and more. A very unique tool that TrendSpider has is Raindrop Charts, which can give you a great edge with your trading.  Get 10% off TrendSpider plans by clicking here & using the coupon code TS10 when signing up. Related Category Related Articles
Thanks for reading! If you enjoyed this article, please consider following us on twitter @StockBrosTrades and/or subscribing to our free newsletter to get articles like this sent to you when they are posted!
|
 Categories
All
Archives
September 2022
|


 RSS Feed