 Moving averages are commonly used in stock trading. The 2 most common MA's are the Simple Moving Average and the Exponential Moving Average, which we will explain in this article. What is a Moving Average?In stock trading, a moving average is a line on a chart that represents past price action. Moving averages are mainly used in technical analysis to follow/determine price trends and/or identify support and resistance levels. Simple Moving AverageHence the name, this is the easiest moving average to understand. It is a basic average of price action over a specific period of time. Below is the formula. 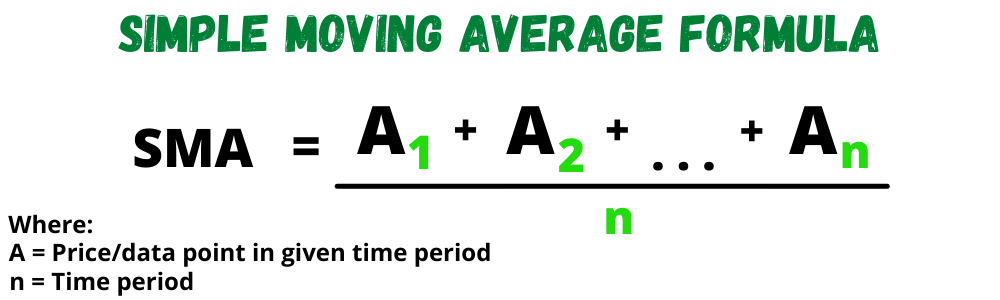 Don't worry if you don't understand the formula at first glance. We'll make it simple. For example, in the chart below we used a 7 SMA just to make things easy. Since this is a daily time frame chart, the SMA measures the last 7 days of price action. If it was a 15-minute time frame chart, the SMA would be measured using the last 7 15-minute candles. Let's do the math. The last 7 day's closing prices in this chart are: 124.40, 116.97, 114.97, 115.08, 113.16, 116.5, and 113.02. If you add these numbers together and divide the sum by 7, you get 116.30 as your answer. This makes sense because if you take a look at the chart, the 7 SMA (blue line) is sitting exactly at 116.30. The good news is you don't have to do any calculations yourself, but it's always good to know how the indicator actually works. 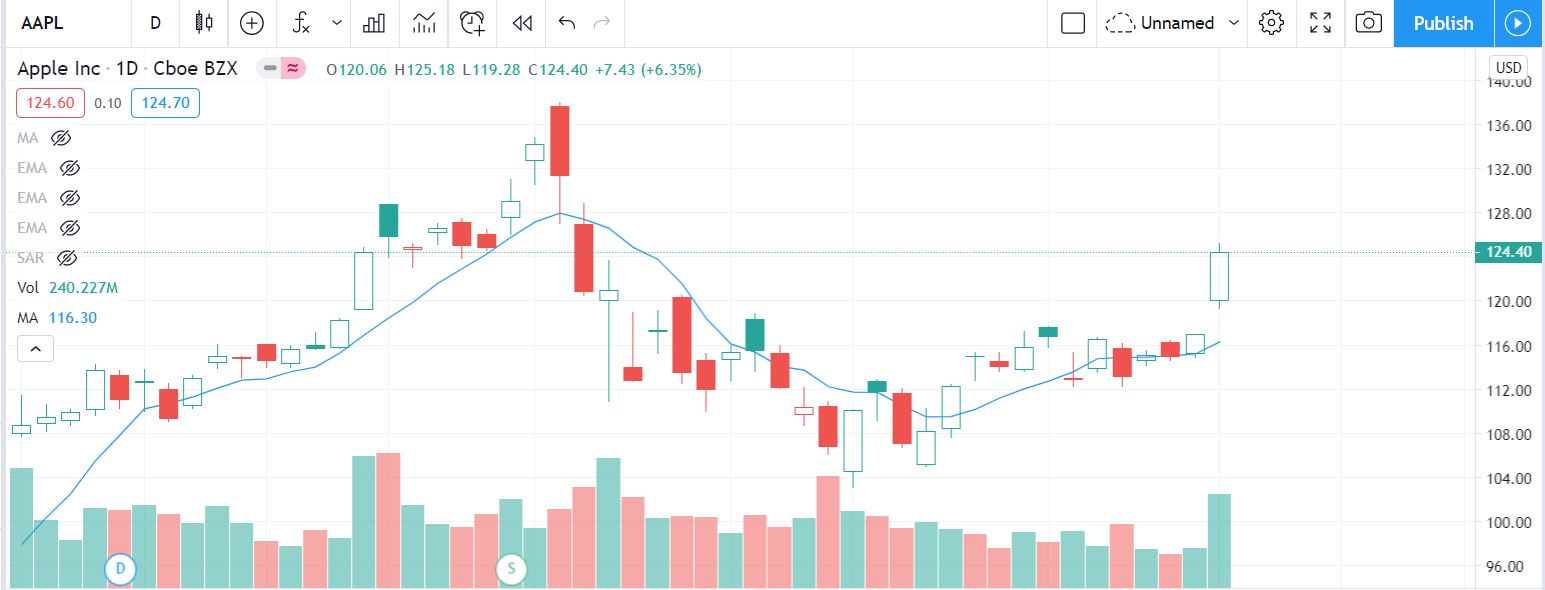 Exponential Moving AverageEMA's are a bit more complicated but the idea is still simple. We won't go through the formula but essentially, exponential moving averages are like simple moving averages, except that EMA's place more weight on more recent price action. A 7-period EMA will place less weight on the price action from 7 days ago compared to the most recent day. This creates a moving average that is more sensitive to price movement, which may be a good thing by helping you anticipate trends faster, but it can also be bad by tricking you into thinking a trend change is happening when it actually isn't. SMA's are smoother compared to EMA's but both are good in their own way. In the chart below, we put a 9 period EMA (orange line) with a 9 SMA (blue line) just as a direct comparison so you can see the difference. As you can see, the 9 EMA is quicker to act on price moves, causing the SMA to trail behind it. 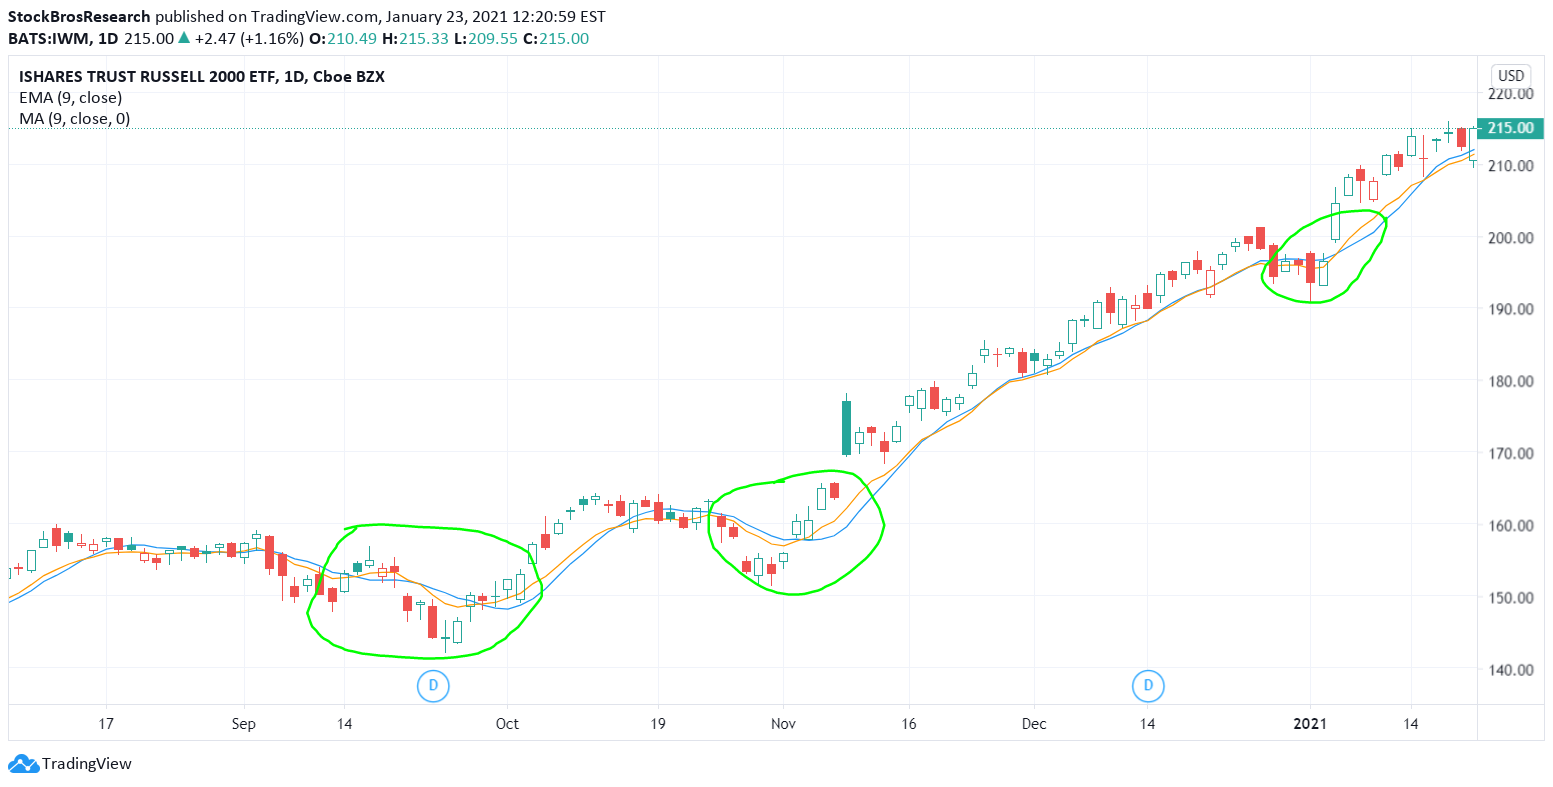 Commonly Used Time Periods For MA'sThe most traditional moving average combination is the 50 SMA paired with the 200 SMA. Other moving average time periods traders commonly use are: 5,9,10,15,18,20, and 100, but we've seen traders use many other time periods. Just as EMA's are more sensitive to price action than SMA's, moving averages with shorter time periods are more sensitive to price movements than longer period MA's. Traders or investors can essentially adjust moving average periods to a sensitivity that they are confident with. Moving Average StrategiesUsing them as support and resistance levelsMarked in the chart below, you can see times where NFLX has supported or resisted near its 50 or 200 SMA on the daily time frame (the 50 SMA is the green, faster-moving line). Just this simple chart with 2 moving averages could've helped a trader or investor make money on NFLX stock by using the MA's as support and resistance guidelines. 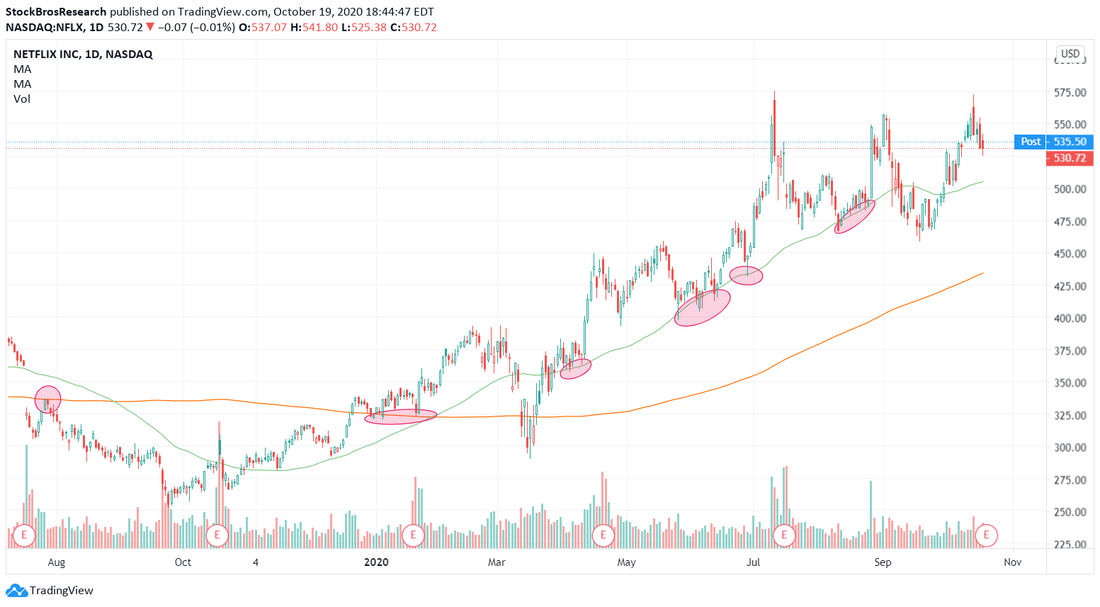 The strategy above doesn't always work so well though. Netflix is an example of a stock that respected those moving averages. Below is a stock that somewhat respected the 200 SMA (orange) but ignored the 50 SMA for the most part. 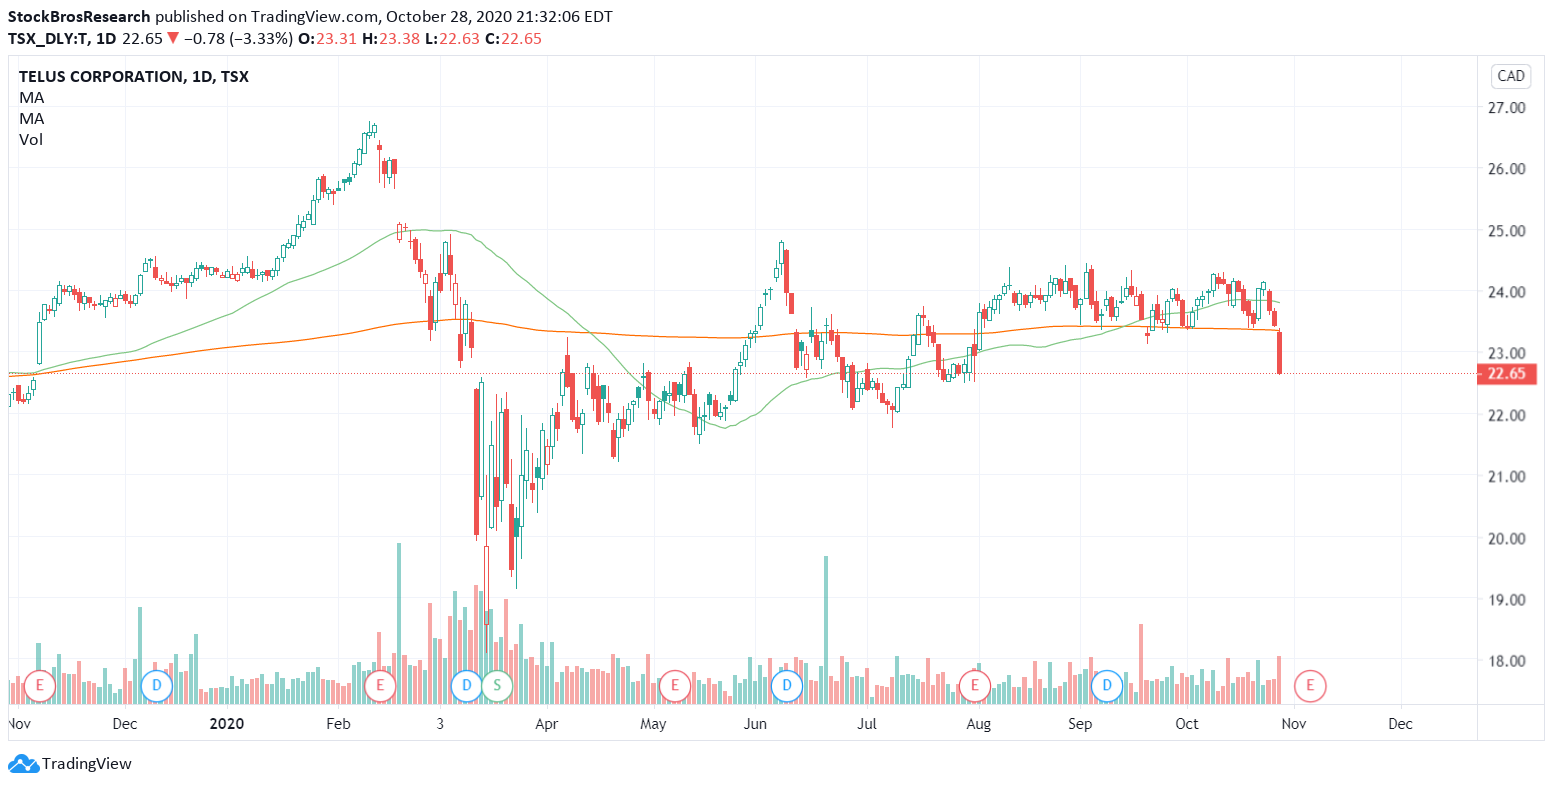 Telus daily time frame In the scenario above, if you tried to use the 50 SMA as a buying or selling point, you'd get chopped around as the stock seemed to move up and down with no regard to the 50-day moving average. So, what do you do with a stock that doesn't respect those moving averages? There's a few options. The first option is to find another stock that is more predictable with those particular MA's. Another option would be to change your MA's or your time frame as some stocks work better in specific time frames. There are lots of different combinations of MA's that you can use, it's entirely up to you and what works best for you. Think of it like this, stock trading is about finding patterns and capitalizing on those patterns in order to profit. If there's no clear pattern on a particular stock with a 50 and 200 SMA combination, then you can either switch the moving averages around and find ones that CONSISTENTLY work for that particular stock, or just find another stock that suits your usual moving averages. Conversely, you could ignore moving averages altogether for that stock and focus on other chart patterns. For example, we normally use the 9 and 20 exponential moving averages along with the 50 SMA. Sometimes we'll add the 200 SMA in there and/or remove one or more MA's depending on the stock. Some stocks work really well with the 9, 20, 50 combination (you can read all about this by clicking here), while some don't. Below is an example of the 9, 20, 50 combo that we're referring to from one of our previous articles. Again, you can read our swing trading momentum strategy article to learn all about it. The green arrows were good entry points based on the criteria. 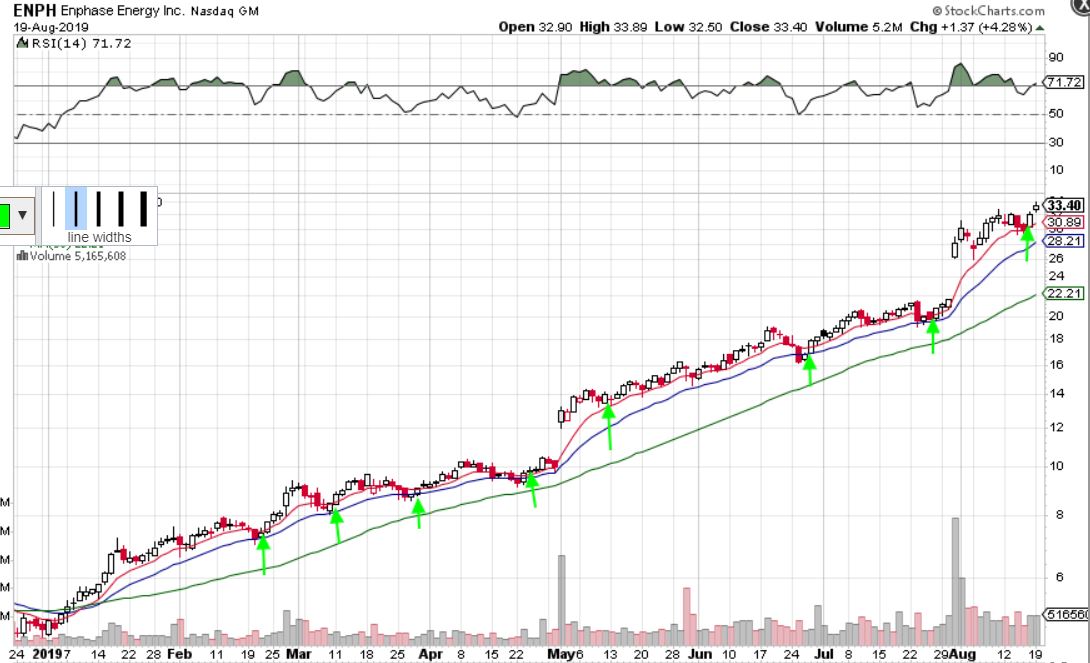 Moving Average CrossoversAnother strategy is to look for moving average crossovers. What we mean by this is the lower time period moving average crossing over or under the longer period moving average. A shorter-term MA crossing over a longer term one can be seen as a bullish momentum indicator, and vice versa. We don't use this strategy too often but many traders do. Below you'll see an example of 2 MA crossovers on the AAPL daily chart. The moving averages used are the 20 EMA (blue) and 50 SMA (green). 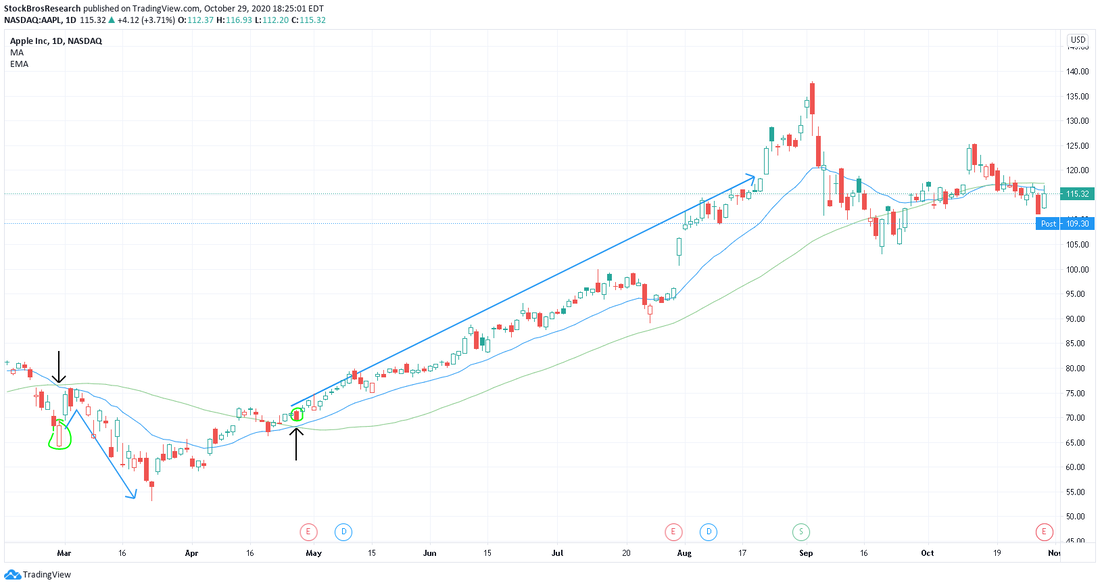 The first crossover on this chart is to the downside, which saw the stock bounce back up to the EMA after the 20 crossed under the 50, and then AAPL proceeded to drop. In April 2020, there was a bullish crossover that saw a strong up trend before eventually dropping off. However, just as with any strategy, this does not always work. In the chart below, we can see a bullish cross over in the NASDAQ index, followed by a move down. 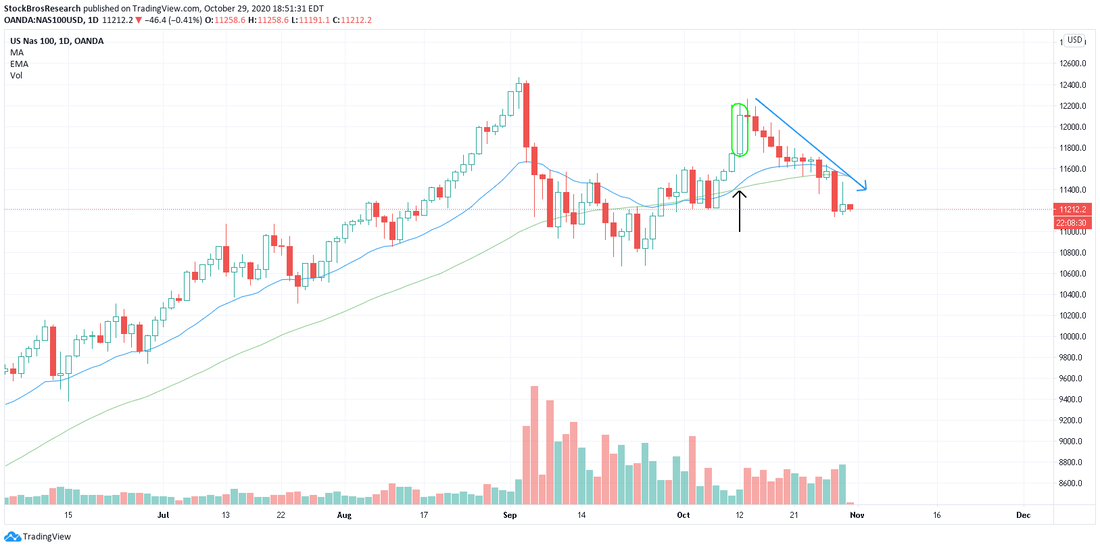 The idea is that over time, trading crossovers should get you more profits than losses if you know how to manage your trades correctly. Also, if a crossover happens and the stock is overextended in either direction, you may want to wait for some sort of pull back (if long) or bounce (if short) before entering a position because you generally don't want to buy or short into overextended moves. As with any strategy, this will work better on certain tickers, and should be backtested or tried with small amounts of money before actually using it. Read: How to Backtest a Stock Trading Strategy - No Coding Required It's not recommended to use MA crossovers on something that is trending sideways. If you do this, you'll have the moving averages constantly crossing over or under each other with the stock not doing much of anything, which will most likely fake you out. Refer to the red area in the chart below Example of MA crossover fake outs: 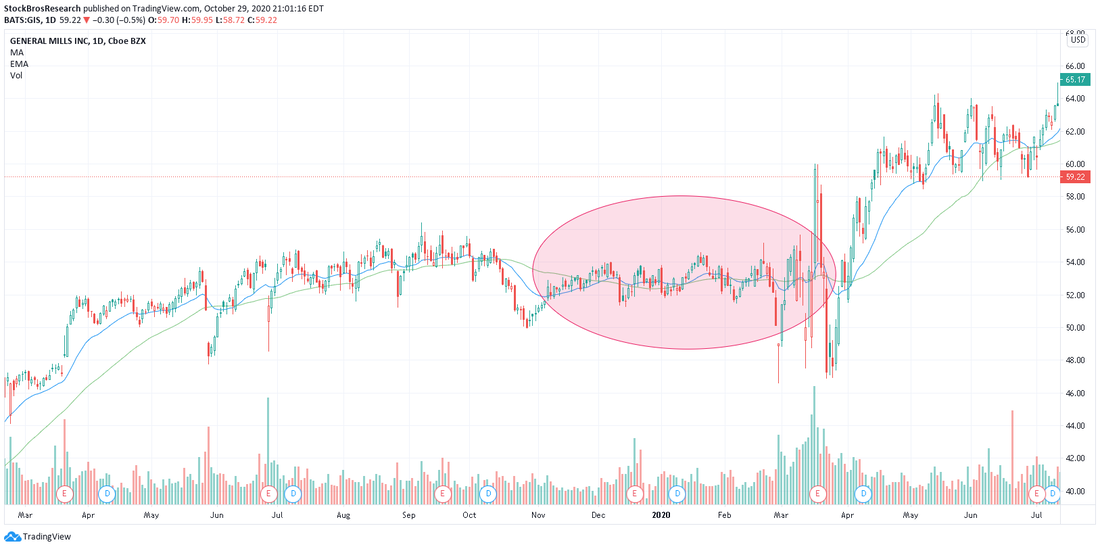 As you can see, when GIS didn't have much of a trend, the MA's kept crossing over each other, but no real direction came out of it. That's why the ticker you choose is important too! Backtesting moving average crossovers: We wanted to test the effectiveness of basic moving average crossover strategies, so we did, and we wrote all about it in this post here: Do Moving Average Crossovers Really Work? Backtesting Golden Crosses and More Below is one example from that article that tested the performance of the 20 EMA / 50 SMA crossover against XLF going back 19 years. The results weren't too bad. If you're interested in learning more and seeing more examples, we suggest reading the full post. 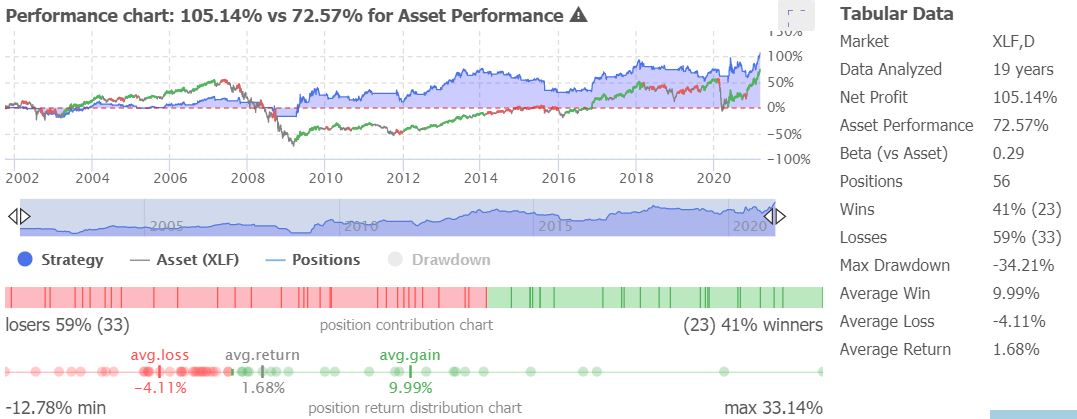 The TakeawayMoving averages work (and don't work) in their own way. If certain moving averages aren't working on a certain stock, then don't bother using them. After all, stock trading is about finding patterns. If there is no pattern, don't waste your time; find better setups. This is especially true in sideways trends. Moving averages are almost completely useless in sideways trends! The flaw of moving averages in general is that they are lagging indicators because they are based on past prices. Therefore, they can potentially be too slow to react sometimes. If you can be profitable using only moving averages, then koodos to you. Generally speaking, moving averages should be combined with other things such as classic chart/candlestick patterns (such as the engulfing candlestick), volume patterns, etc. The more things line up, the higher the success rate of the trade! Need Chart Software?TrendSpider is a top-tier charting platform where traders can put their technical analysis skills to work. It offers automated technical analysis tools, dynamic price alerts, back testing, 1-on-1 training sessions for those who need extra help, and more. A very unique tool that TrendSpider has is Raindrop Charts, which can give you a great edge with your trading. Get 10% off TrendSpider plans by clicking here & using the coupon code TS10 when signing up.  Thanks for reading! If you enjoyed this article, please consider following us on twitter @StockBrosTrades and/or subscribing to our free newsletter to get articles like this sent to you when they are posted! Related Category Related Articles
|
 Categories
All
Archives
September 2022
|
 RSS Feed