Do Moving Average Crossover Trading Strategies Really Work? - Backtesting Golden Crosses and More3/18/2021
 Moving averages are probably the most common indicator used in trading strategies,whether its stocks, forex, or crypto. There are many ways to trade them such as using them as support/resistance levels, buying when the price crosses over a specific moving average, buying when moving averages crossover each other, and more. We've gone over different kinds of moving average strategies in our previous MA article which you can read here: How to Use the Simple and Exponential Moving Average to Trade Stocks However, this article will specifically look at the results of using moving average crossover strategies. Do Moving Average Crossovers Work?To determine this, we'll be backtesting the strategy on 4 tickers with 5 different moving average combinations. If you're unfamiliar with backtesting, check out this article here: How to Backtest a Stock Trading Strategy - No Coding Required Here's how we'll lay it out: 4 tickers for each strategy. Each ticker will be much different than the other. Ticker 1: SPY Ticker 2: XLF Ticker 3: AMZN Ticker 4: GME The SPY will be tested over a period of 4000 daily candles, XLF will be 5000 daily candles, AMZN will be 2000 daily candles, and GME will be 3000 15-minute candles. The reason for testing 15-minute candles on GME is because people tend to trade shorter-term on "hype stocks" and because we want to test the strategies on more than just 1 time frame. Testing on these 4 stocks can give some sort of idea of how the strategy can work with different kinds of tickers. The 5 strategies will be:
The 11 and 49 EMA backtest was added to this article on April 4, 2021, 2 weeks after the original article was published (the backtest timing for that one will be off by about 2 weeks). Testing the Golden Cross The golden cross is a popular crossover in which the 50 simple moving average crosses over the 200 simple moving average. A crossover can be seen as a bullish signal, so let's test out how this indicator works out in the long run. Our entry criteria will simply be when the 50 SMA crosses over the 200 SMA on the daily time frame. 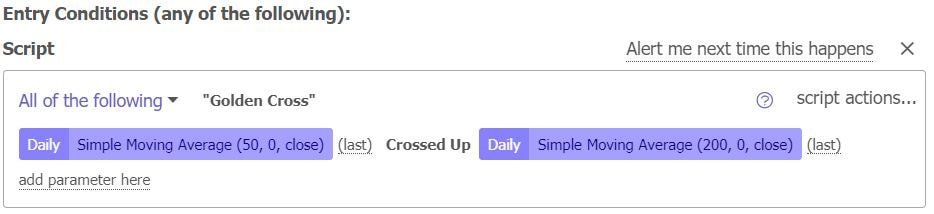 Our exit criteria will be the opposite, exiting when the 50 SMA crosses under the 200 SMA. 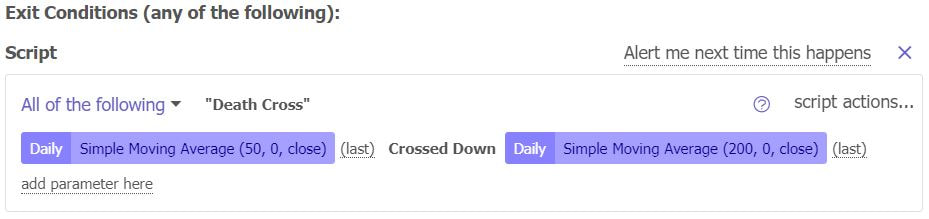 Golden Cross vs SPY: Here are the results of the strategy vs. the SPY since about 2005. The golden crosses would have returned you 168.84% vs 224.39% for the SPY, with a total of 6 winning trades and 2 losing trades. The max drawdown was about 32%, and overall, this strategy has less volatility than owning buying and holding the SPY. 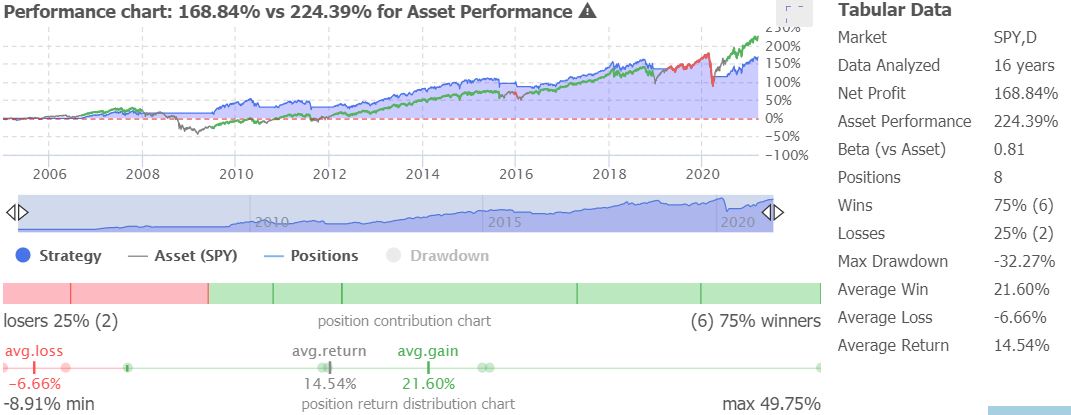 Here's an enlarged version of the returns (the blue is the trading strategy's performance). 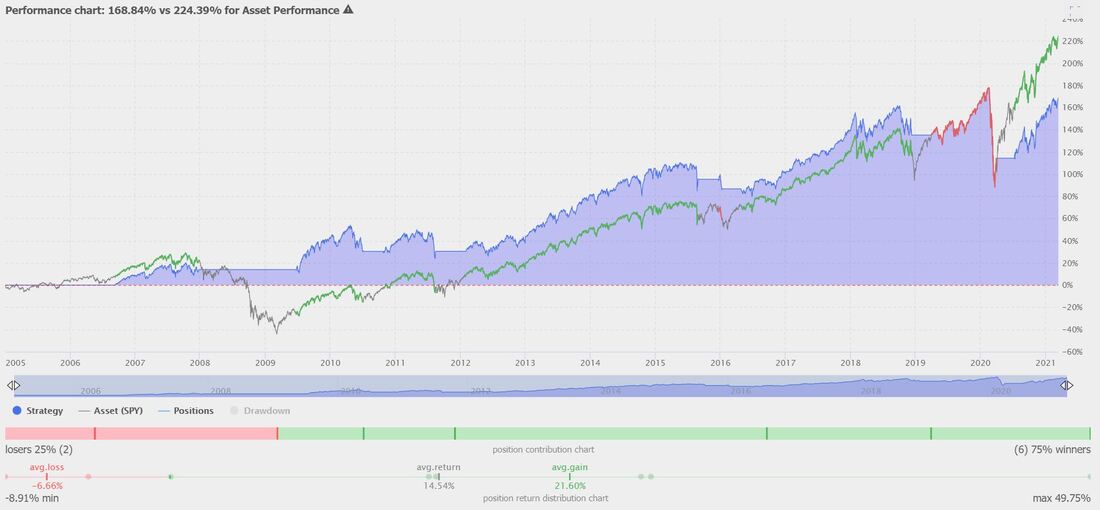 Golden Cross vs XLF (financial ETF): Here's how the strategy worked against XLF, the financial sector ETF. The golden cross outperformed over the long run by avoiding the big drawdown caused from the 2008/2009 crash. It returned 133.2% vs 54.69% for XLF, while maintaining a relatively low beta of 0.74. 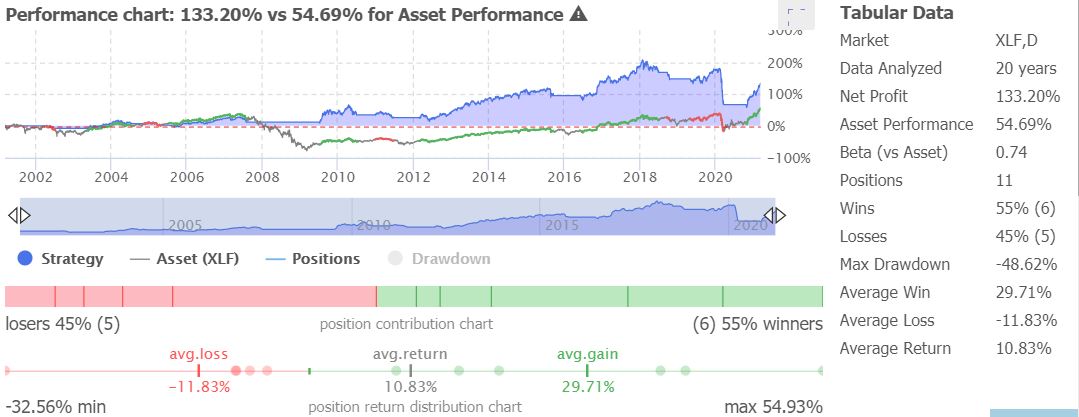 Golden Cross vs AMZN: We decided to do this one starting from 2012. With a 0.44 beta vs AMZN, the golden cross strategy returned 462.6% vs 1143.8% for AMZN. Although only 4 trades were taken during this time period, the average loss was 9.79%, and the average gain was 169%. 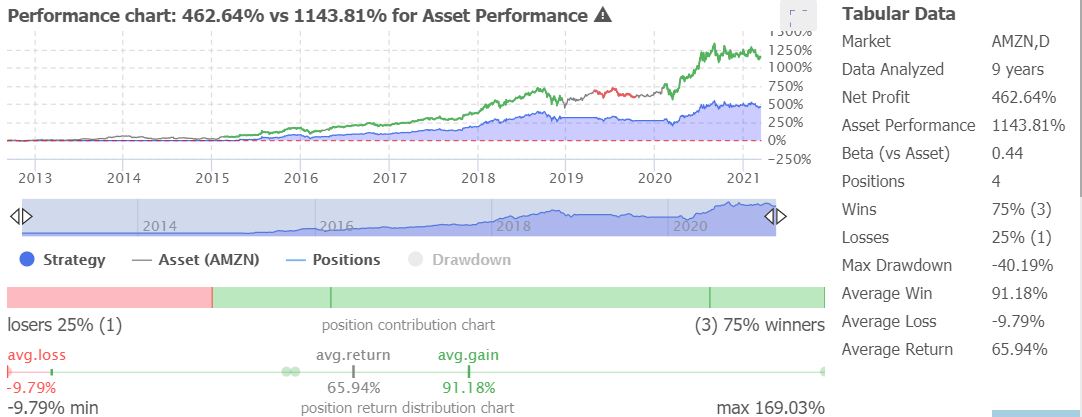 Golden Cross vs GME: In this situation, the strategy returned 3028% vs about 2217% for GME. It did so with a max drawdown of nearly 82% and a beta of 1.14. Sure, it performed great, but your stomach may have turned inside out in the process. 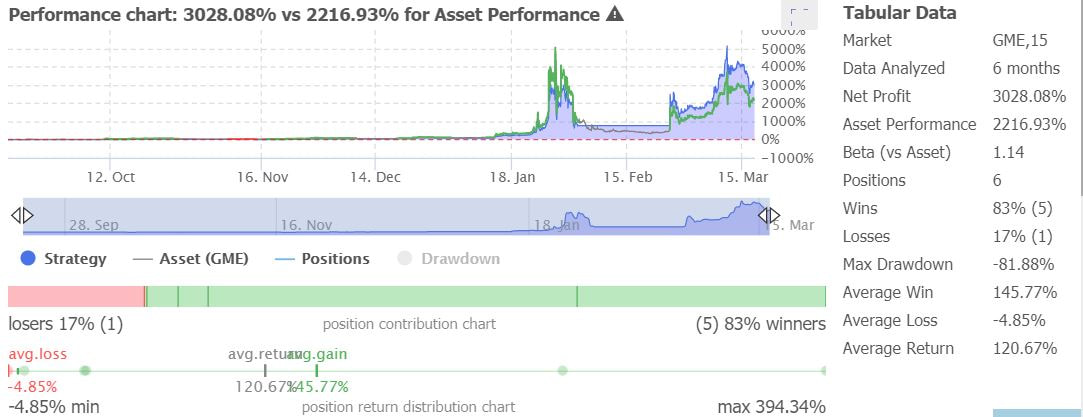 GME is a very interesting stock, so we decided to include the enlarged chart if you'd like to see how it played out. 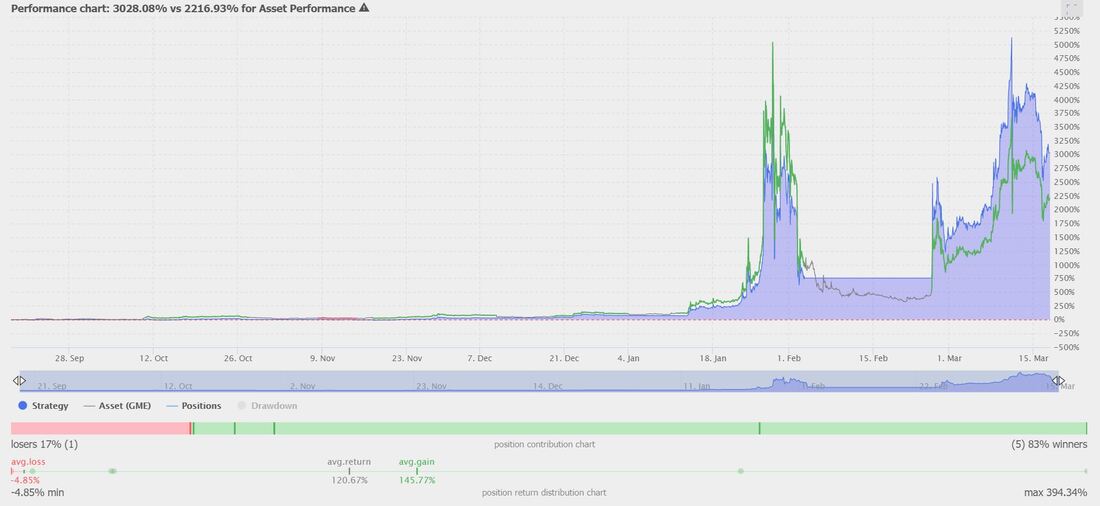 Testing the 20 EMA / 50 SMA crossoverThis is another straight forward strategy that will go long when the 20 exponential moving average crosses over the 50 simple moving average, and will close the long position when the 20 crosses under the 50. 20/50 moving average crossover vs SPY: 98.59% vs 220.35% for the SPY with 0.50 beta. Max gain of 15.88% vs a max loss of 12.49%, and a max drawdown of 28%. Not the best results, but at least it didn't lose money. 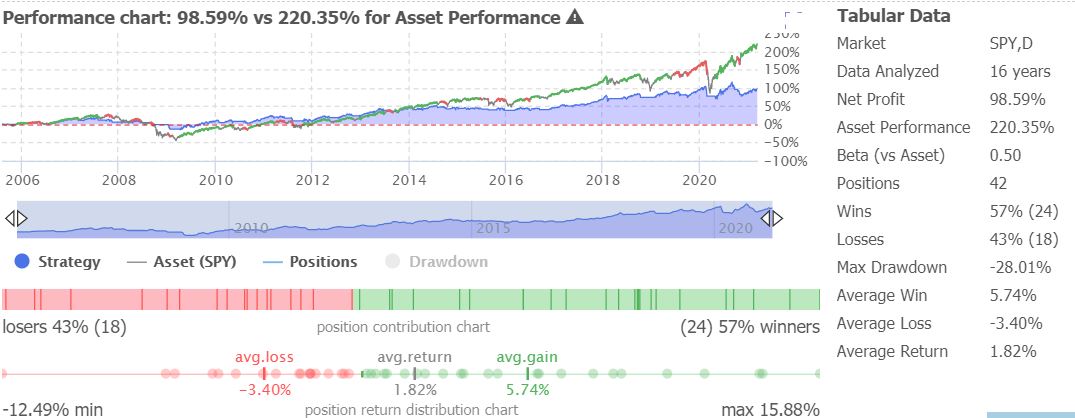 20/50 moving average crossover vs XLF: Just as the golden cross strategy, this strategy outperformed XLF. It did so with a max 34% drawdown and a 0.29 beta, which essentially means it avoided some pretty major drawdowns. The strategy returned 105.14% vs 72.57% for XLF. 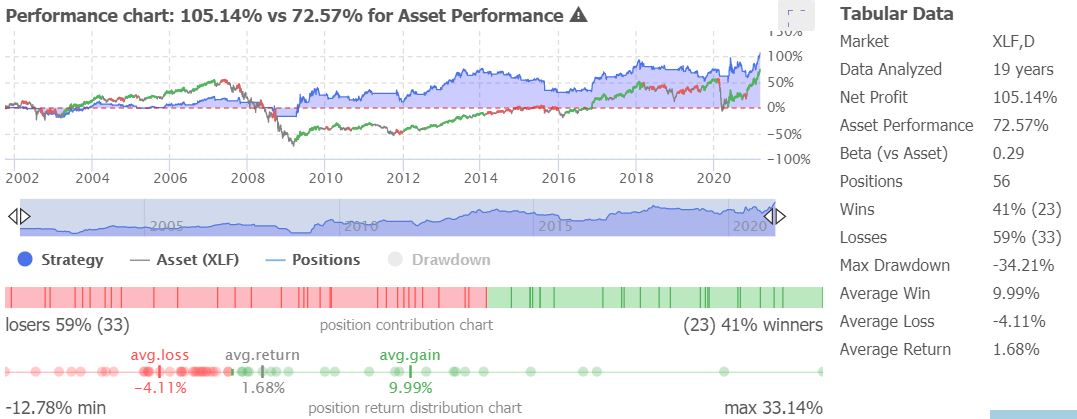 20/50 moving average crossover vs AMZN: This strategy had a 47/53 win/loss rate on AMZN (with 19 total trades), however the average win was 25% vs a 5% average loss. Overall, the return was 321% vs 1056% for AMZN. As you can see near the end of the chart, AMZN itself is trending sideways whereas the strategy is trending downwards. That's why its hard to trade crossover strategies in sideways stocks, you'll get chopped in and out of trades! 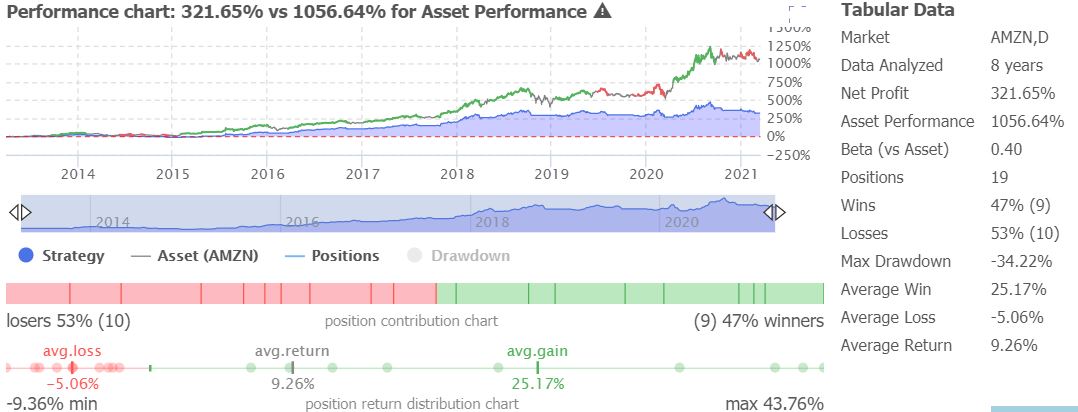 20/50 moving average crossover vs GME: Another outperformance here with GME, returning 2860% vs 2185%. The strategy was able to capture all the major short squeeze moves while having a bit less volatility than the stock itself on the down trend. 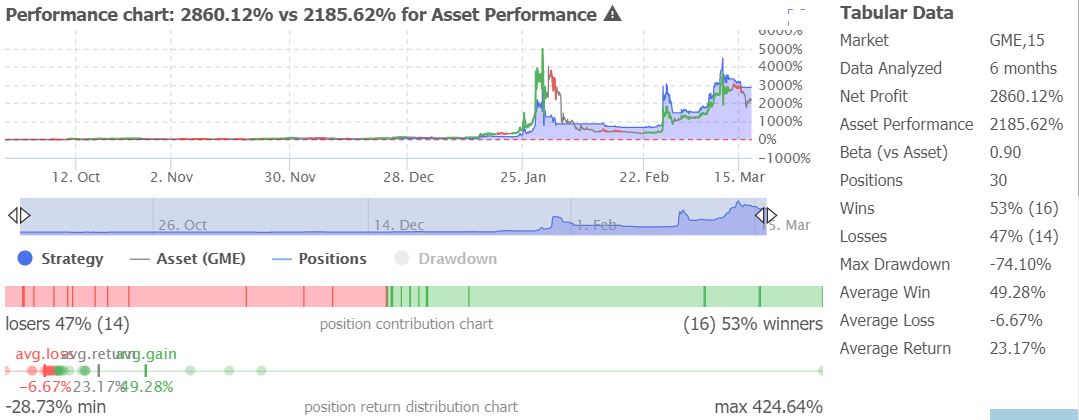 Testing the 9 EMA / 20 EMA CrossoverThe 9 and 20 EMA's have the effect of crossing eachother much faster than the other strategies we tested above, so let's see if using the moving averages are any good. This strategy will go long when the 9 exponential moving average crosses over the 20 exponential moving average, and will close the long position when the 9 crosses under the 20. 9/20 EMA crossover vs SPY: Against the SPY, it was able to sidestep market crashes and major volatility for the most part, having a max drawdown of about 23%. The drawback of this was it returned less than half of what the SPY returned. 103.65% for the strategy vs 222.88% for the SPY. 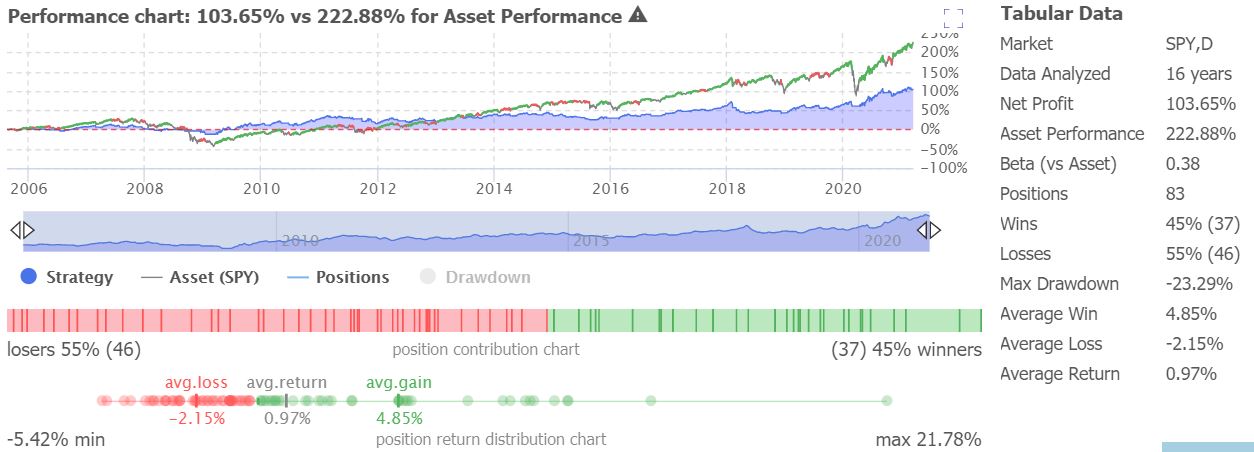 9/20 EMA vs XLF: Unfortunately, this strategy did not work well against XLF, having an overall negative return of -6.8% vs 66.2% for XLF. There were a total of 112 trades taken in this period, with 44 wins and 68 losses. 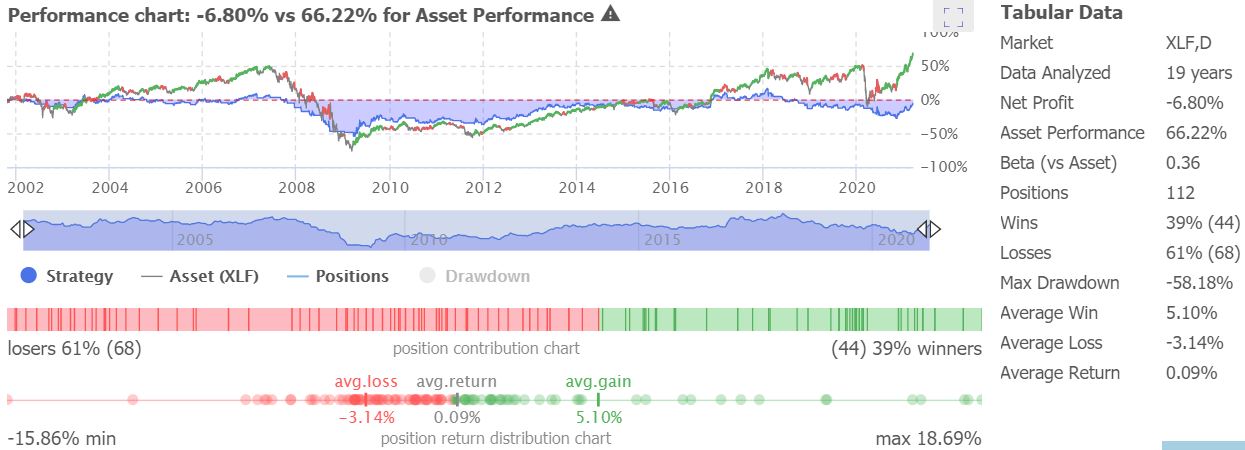 9/20 EMA vs AMZN: In this scenario, the strategy almost just mimicked AMZN but with about half the returns/volatility. It returned 504.8% vs 1034.8% for AMZN. 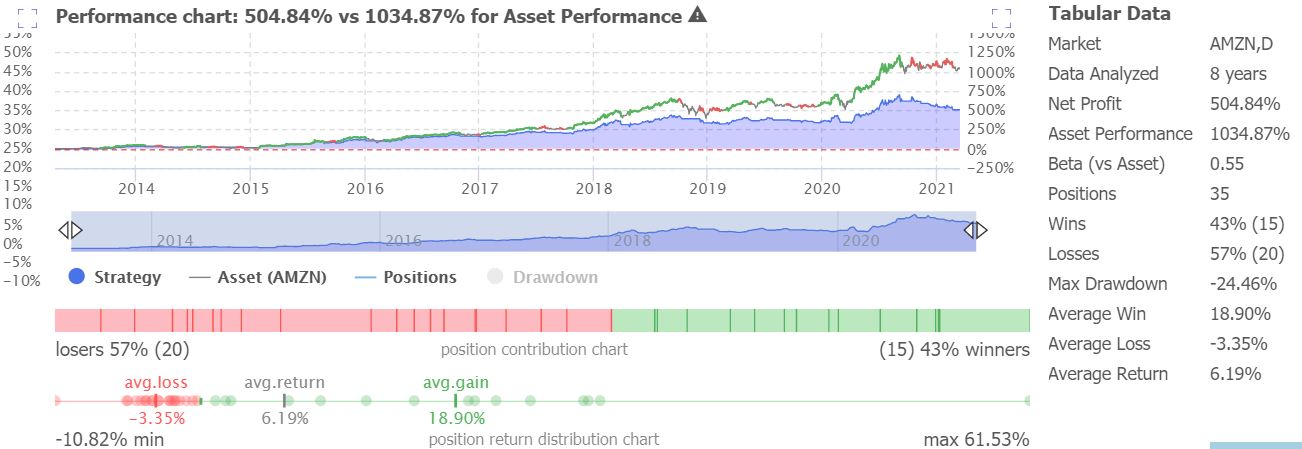 9/20 EMA vs GME: Here we have have slightly lower returns of 1803% vs 2082% for GME but with a noticeably lower beta (0.56). So, perhaps on a risk-adjusted basis, this strategy worked well on GME over this time period. 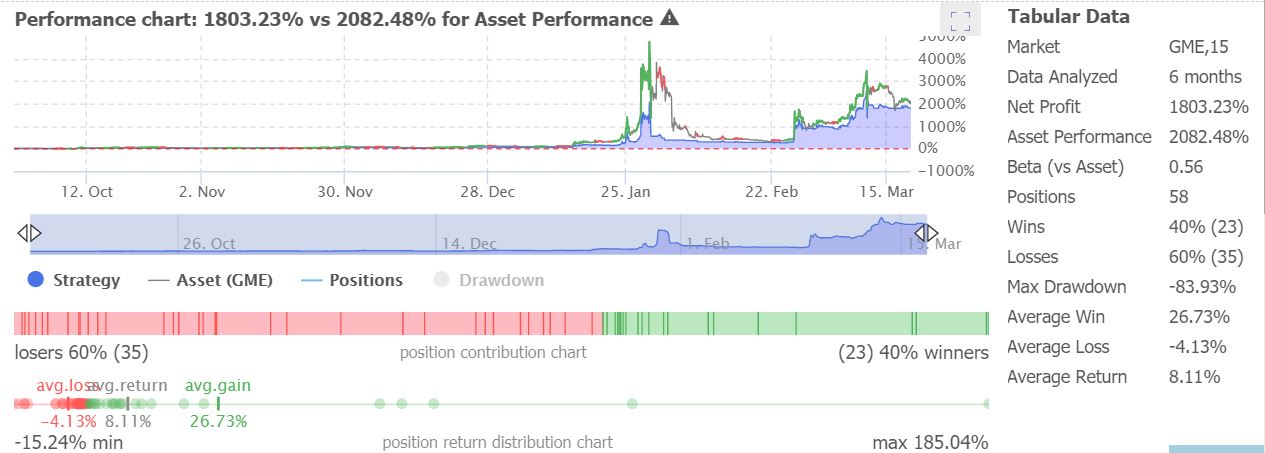 Testing the 50 SMA and 100 SMA CrossoverThis strategy will go long when the 50 simple moving average crosses over the 100 simple moving average, and will close the long position when the 50 crosses under the 100. 50/100 SMA vs SPY: The strategy returned 131.65% vs 230.57% vs the SPY, with a beta of 0.69 and a win rate of 60% over 15 trades. Up until 2016, it was outperforming the SPY (with lower volatility as well), but then it really started to fall behind when it was unable to buy the dip quickly enough in the 2020 crash. 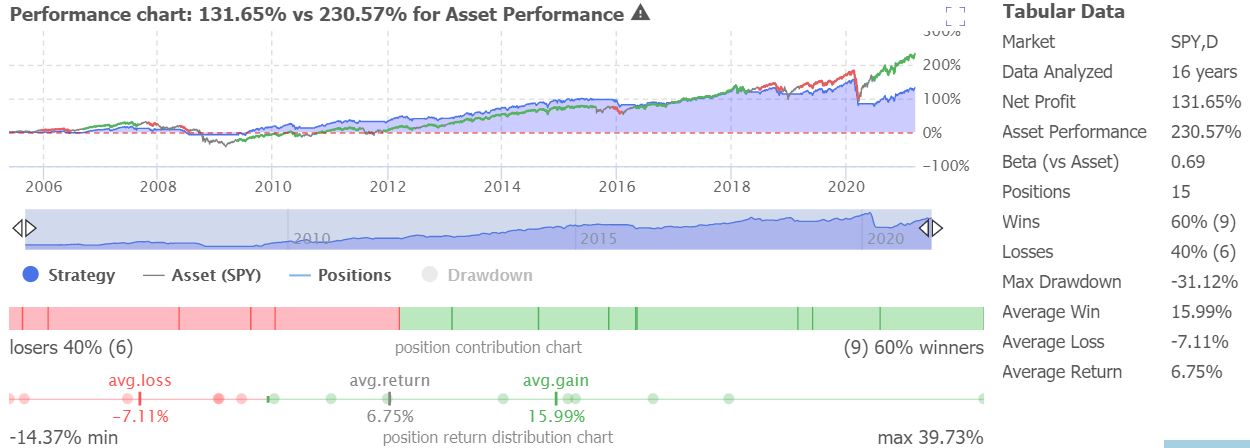 50/100 SMA vs XLF: Excellent performance here relative to XLF. The strategy returned 147.5% vs 55.8%, with a win rate of 55% and a beta of 0.66. The main factor was that it avoided the 2008 crash and went long near the bottom. 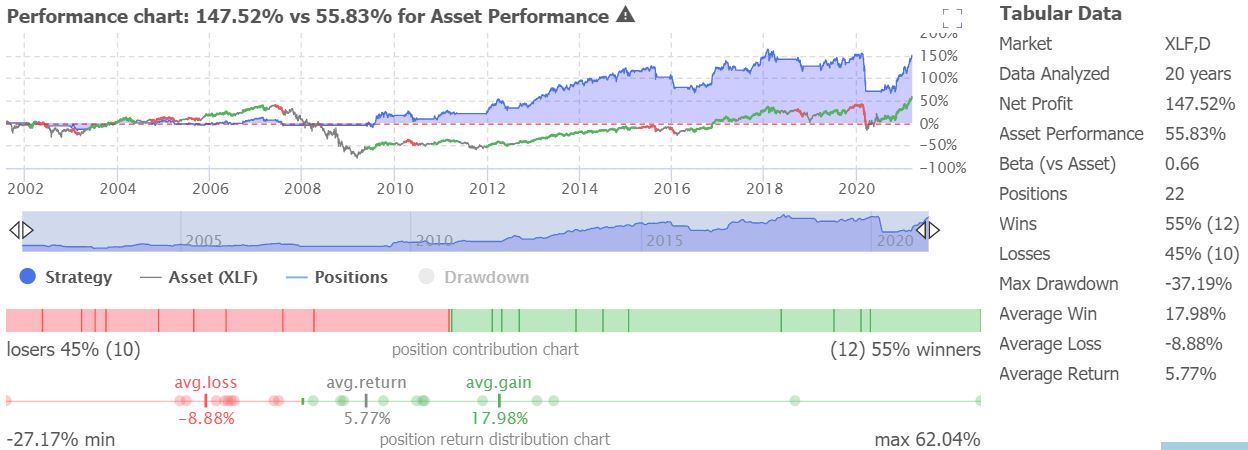 50/100 SMA vs AMZN: The result here is basically almost the same as the 9/20 EMA tested on AMZN above. About half of the beta, and about half of the returns. The average win though was 32.56% vs an average loss of 2.54%. Therefore, when it did take a trade, it was pretty accurate. 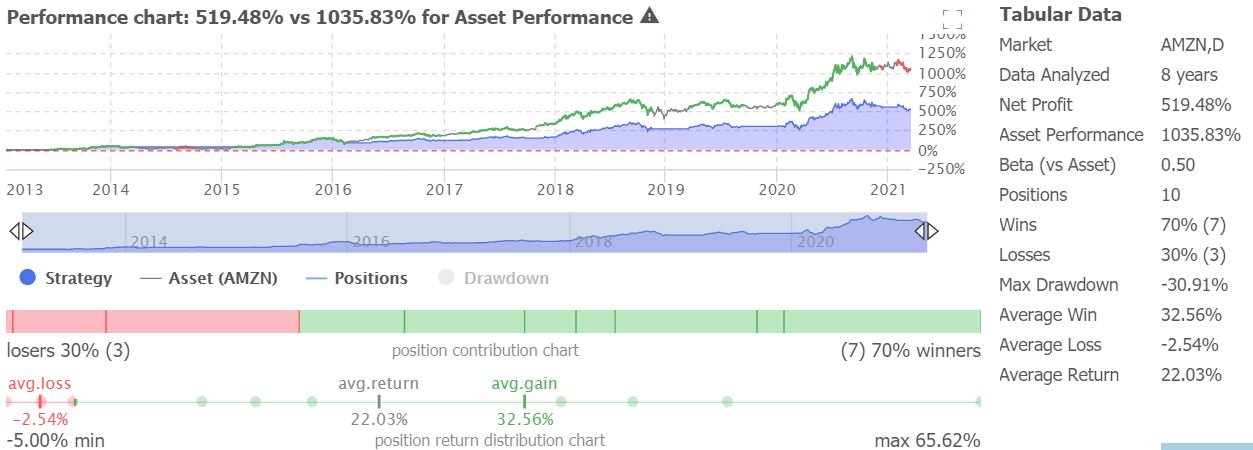 50/100 SMA vs GME: This is the best performance by far out of all the tests. 12494% vs 2233% for GME. The strategy was able to catch all of the moves and sidestep the drawdown much better than the other strategies did. Out of 15 trades, there were 9 wins and 6 losses. The average win was 163.48% and the average loss was 2.49%. 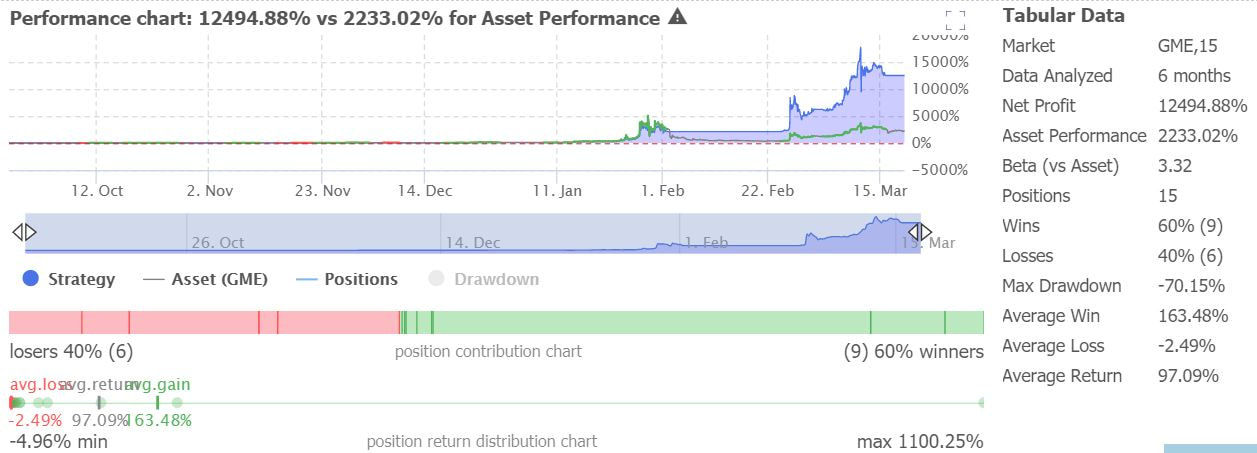 Does The Opposite Work For Shorting?The "short" answer: it depends, but most likely not. It really depends on the ticker you choose. Shorting the SPY or any top stock for an extended period of time can be pretty dangerous since stocks tend to go up over time. We tested a few tickers that would short when moving averages crossed down and then close the short when they crossed back up, and most of them just lost money over time. There were some exceptions though. For example, some of the MA crossovers were able to provide decent profits from GME's large drop after it peaked, but shorting in general is a pretty risky strategy and usually shouldn't be based solely off of moving average crosses. UPDATE April 4, 2021: 11 and 49 EMA Crossover: We recently watched this video on Youtube where TrendSpider interviewed the popular trader Steve Burns (@SJosephBurns). Steve burns was talking about his MA ribbon strategy and how he uses it. In the video, he also mentions that someone did a test and found that the 11 EMA vs 49 EMA crossover had the best results compared to other moving averages. Those 2 moving averages are basically almost the same as using the 10 EMA vs 50 EMA, but we got curious and decided to test it out anyways. Here's the criteria. It simply buys when the 11 EMA crosses over the 49 EMA and vise versa to close out of a position. 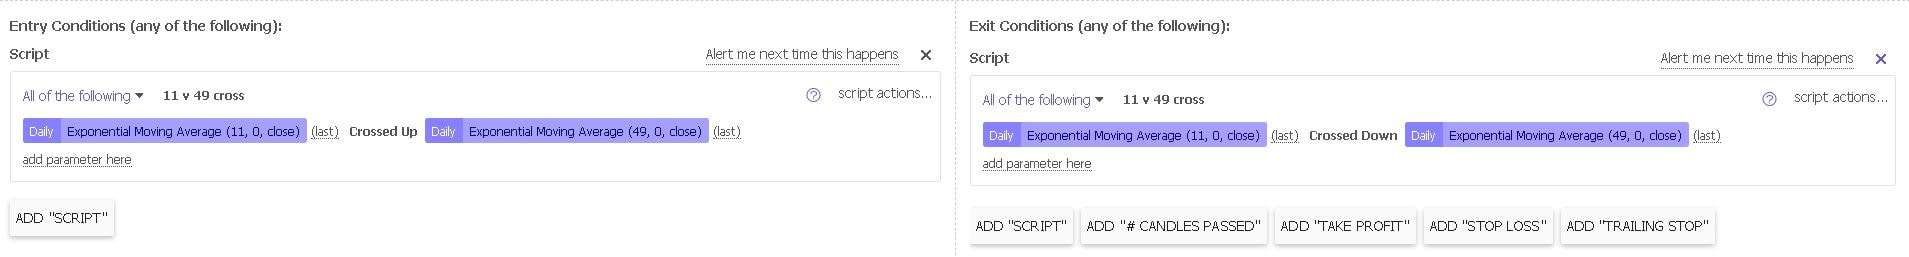 We'll test it on the same tickers for consistency, but keep in mind, the start and end date of the backtest will be off by about 2 weeks compared to the previous ones since we are doing these tests 2 weeks later. Therefore, the results would be a bit different. Without wasting any more time, here are the results. 11/49 EMA vs SPY: Against the SPY, this MA combo had the best results in terms of risk adjusted performance compared to the other combos. It returned over 162% compared to 230% for the SPY, however, it's max drawdown was only under 18%. Average win was 7.42% vs 1.8% average loss with a 45% win rate. Compare this with the other MA combos and you'll see how this one outperformed. 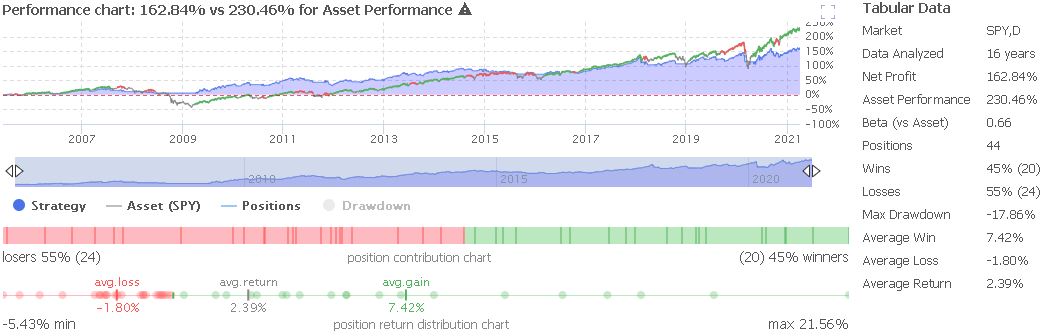 11/49 EMA vs XLF: It also did well against XLF, outperforming the index with only 27% drawdown and 0.15 beta. Pretty decent results, although some of the other tests on XLF were great too. 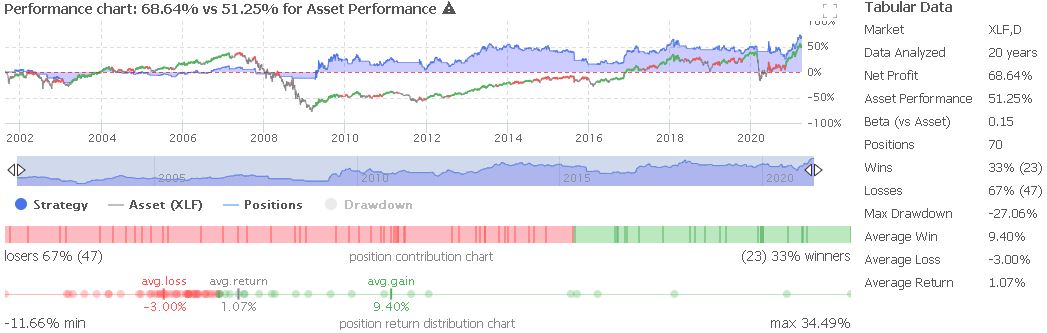 11/49 EMA vs AMZN: This strategy did okay vs AMZN, but didn't perform better than the other MA combos in this particular situation. 381% vs 1092% for AMZN, with a 34% drawdown. 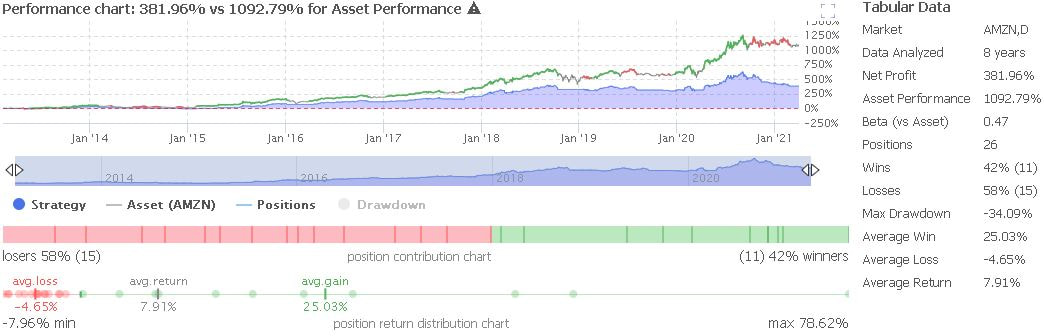 11/49 EMA vs GME: Against GME, it did very well, returning 3853% vs. 1378%, with similar drawdowns to the other strategies. This only really falls short to the 50/100 MA crossover against GME. 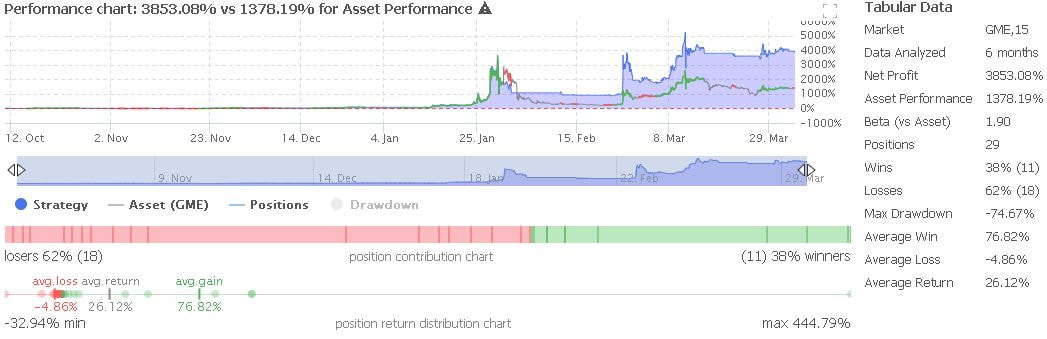 So, that was the 11 and 49 EMA crossover vs. the same tickers originally mentioned. However, what we noticed is that this strategy works pretty well on most ETF's in particular (as you saw in SPY and XLF above). Here's another example on an ETF: 11/49 EMA vs XLI: Over the long run, the 11 vs 49 EMA almost matched XLI's performance, but it only had a 24% max drawdown which is much lower than the ETF itself. It also had a beta of 0.77. This is a pretty great result. 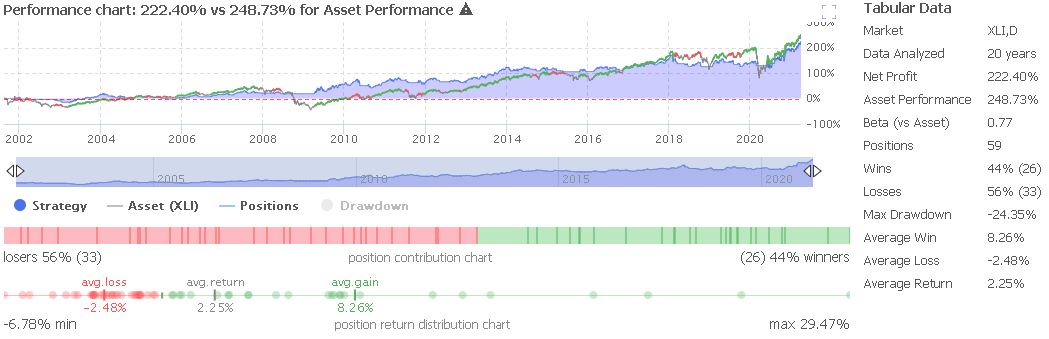 Here's an enlarged version of the XLI performance just to show how the strategy was able to sidestep lots of volatility and still produce a similar result. 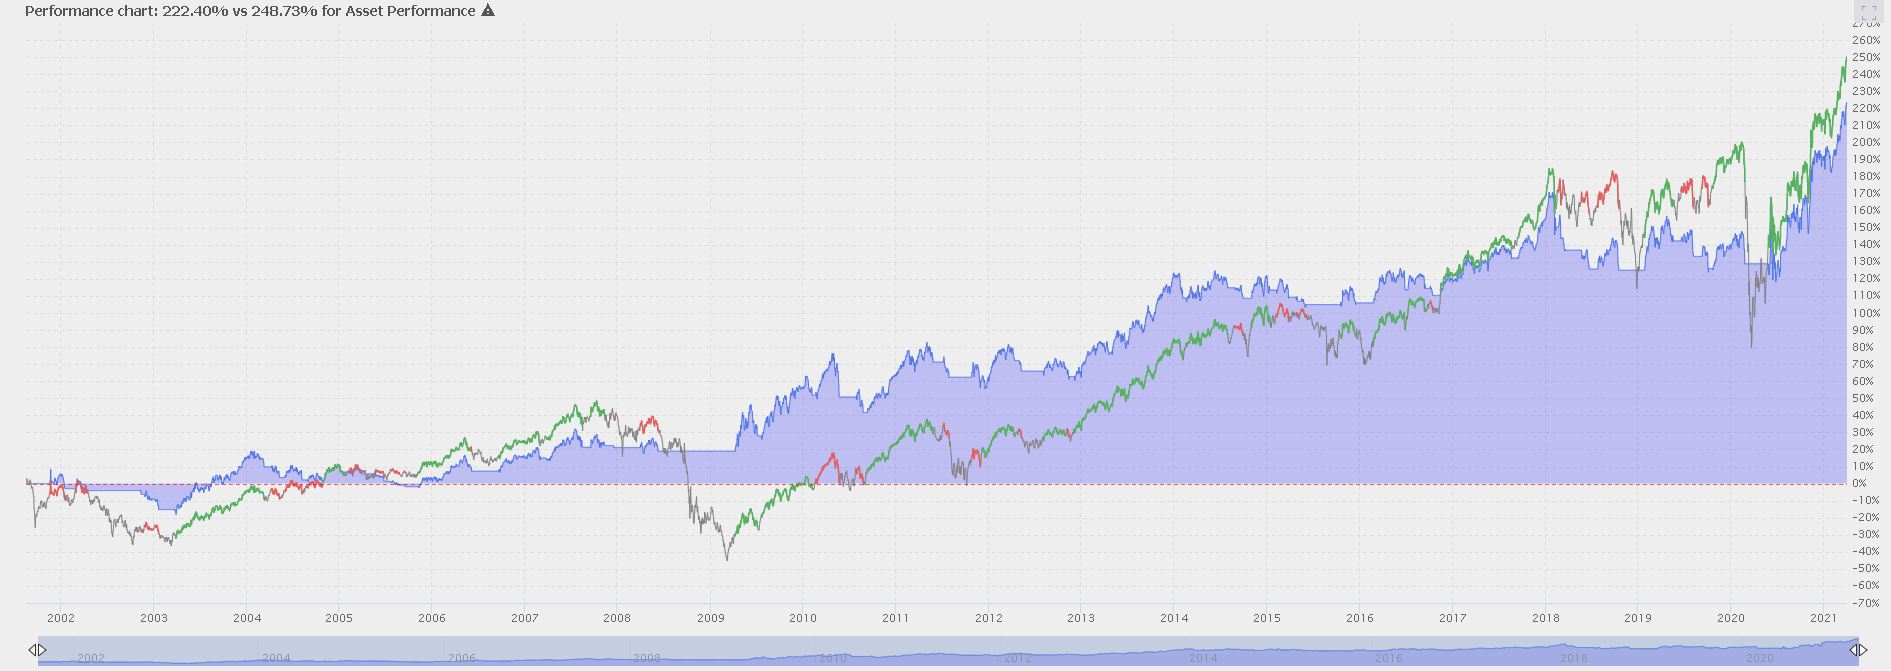 We've tested the 11 and 49 EMA on other ETF's as well with multiple time frames and we liked the results on most of them. That's not to say that it doesn't work well on individual stocks though. For example, here's the performance vs ticker X (United States Steel): 847% vs -32% for X is a fantastic result to say the least. It's all about finding what strategy works for each ticker. 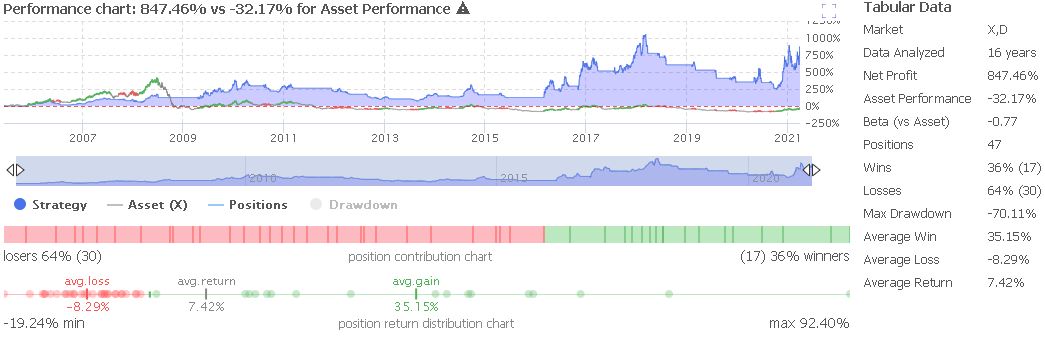 The 11 vs 49 EMA is definitely a good strategy according to the backtests we've done, and is worth looking into if you want to backtest something on your own. The TakeawayMoving average crossover strategies aren't perfect but they are decent for trend following and can generate some good profits over time if done on the right stocks. Trading can be a lot more complex than just following basic moving averages, but it's good to know that even something basic like this can work at times. Usually, these strategies provide a lower-volatility alternative for following the trend compared to buying and holding. This may be good news for investors/traders that are more risk averse. When testing these strategies on an individual ticker, there sometimes were extended periods of time where no positions were being taken. But, when positions were taken, the wins were often more profitable than the losses. Perhaps if you're testing out moving average crossovers in real life, you could just hop on to another ticker that crossed over after a setup you were in has already played out. That way, you can avoid being out of the market for too long. This of course, is not financial advice and you should test these things out for yourself before taking any big risks. It is also important to note that you may have a better edge in trading if you compare multiple indicators/catalysts rather than just relying on moving averages, and that MA strategies are hard to use in sideways markets. Lastly, these backtests are for informational purposes only and they may not portray past results with 100% accuracy due to factors such as commission costs, bid/ask slippage, and more. Past performance does not guarantee future results. We used TrendSpider for these backtests. Get 10% off TrendSpider plans by clicking here & using the coupon code TS10 when signing up.  Thanks for reading! If you enjoyed this article, please consider following us on twitter @StockBrosTrades and/or subscribing to our free newsletter to get articles like this sent to you when they are posted! Related Category Related Articles
|
 Categories
All
Archives
September 2022
|

 RSS Feed