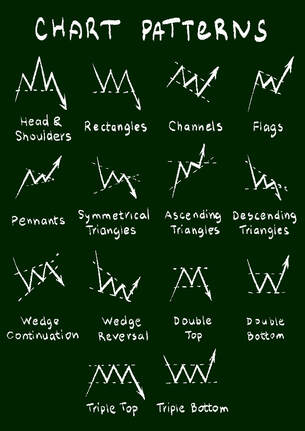
Types of Patterns to KnowChart patterns can be categorized as bilateral, continuation, or reversal patterns, explained below. 1. Bilateral Patterns: Bilateral patterns can be seen as neutral chart patterns that can go in either direction. Some examples are ascending, descending, or symmetrical triangles, as shown below. When we come across a bilateral pattern, we usually trade it in the direction of the trend. For example, look at the ascending triangle in the top left of the image below. Since that chart was already in an uptrend, we're more inclined to take a long position either after a break out or in anticipation of a break out. The trend is your friend! However, if an ascending triangle breaks down (like the bottom left pattern), you have no business being long according to that chart pattern and you could probably make money by going short. The same is true for the other patterns. 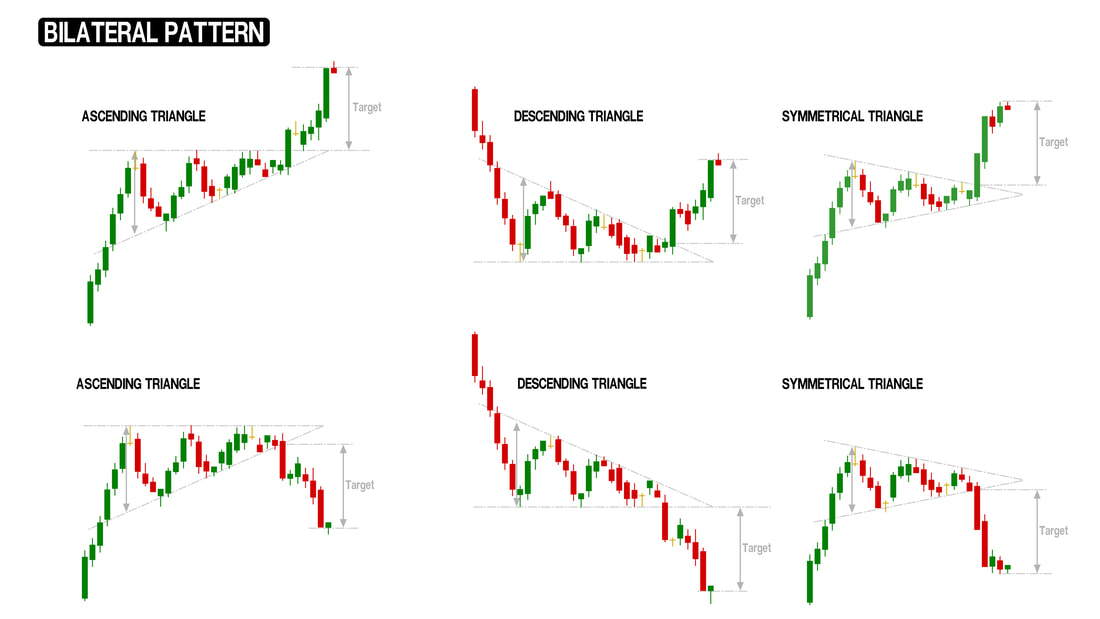 2. Continuation patterns: Continuation patterns are exactly what they sound like. Continuation is just a technical term for a chart that breaks out of a range to keep moving in the direction of the trend. Technically, these are also bilateral before they break out, but remember, the trend is your friend. If a stock is trending upwards, it has a higher chance of continuing in the same direction regardless of a pattern being bilateral. Examples of continuation patterns are pennants, falling wedges, and rectangles, as can be seen below. Our personal favorite is the bullish pennant. 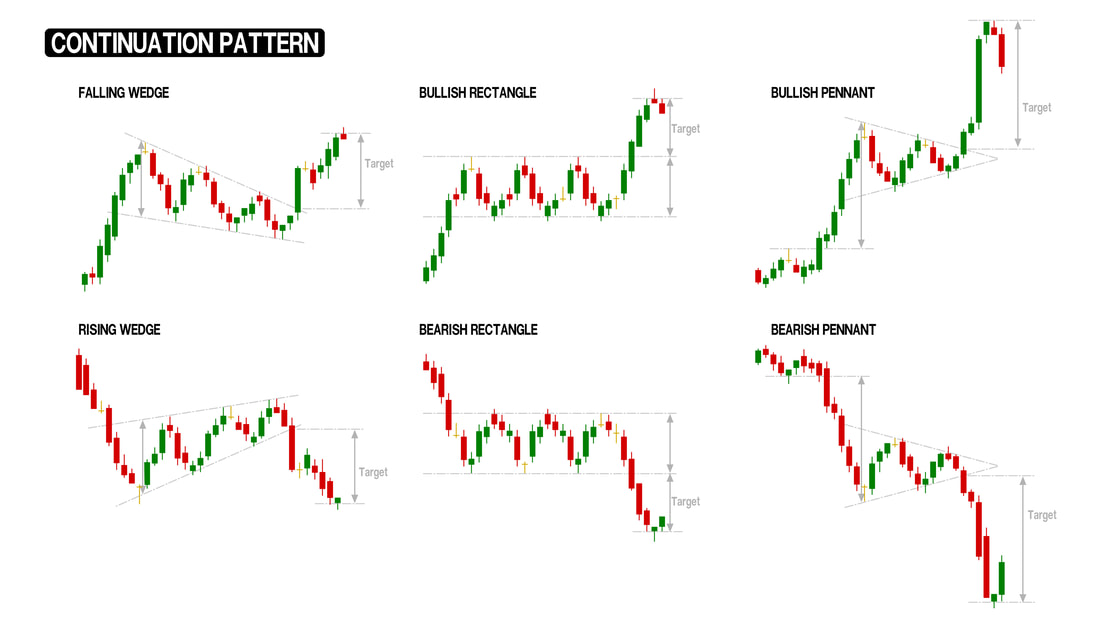 Cup & handle patterns (below) are strong too. A bullish cup and handle that happens during an uptrend can signal a continuation, while a bullish cup and handle in an overall downtrend can also signal a bullish reversal. 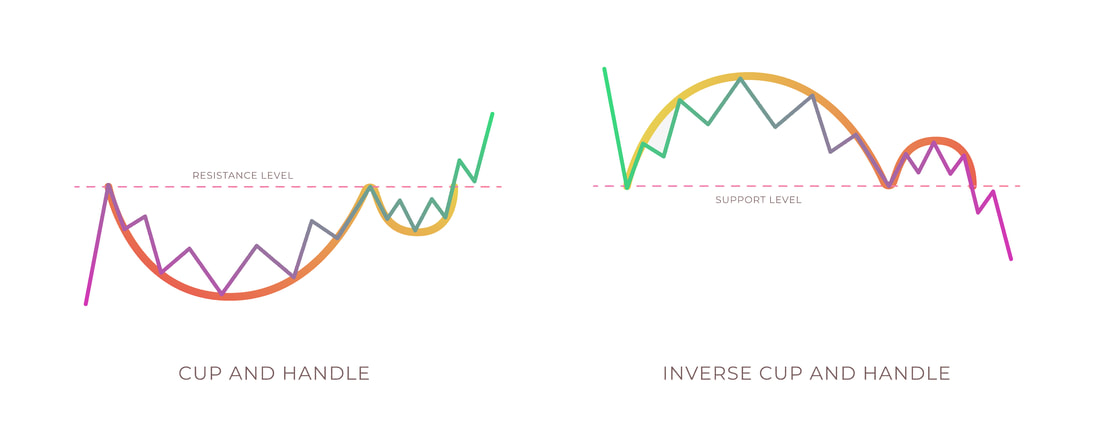 3. Reversal patterns: Finally, you have reversal patterns such as double tops, head and shoulders, and rising wedges. These patterns can signal tops or bottoms. You may have noticed that wedges are listed below as well as being listed above. The difference between the falling wedge above vs the falling wedge in the "reversal" section is that the continuation falling wedge is happening in an uptrend and the reversal one happens in a downtrend. You can also add the cup & handle patterns to the reversal section, like we mentioned earlier. 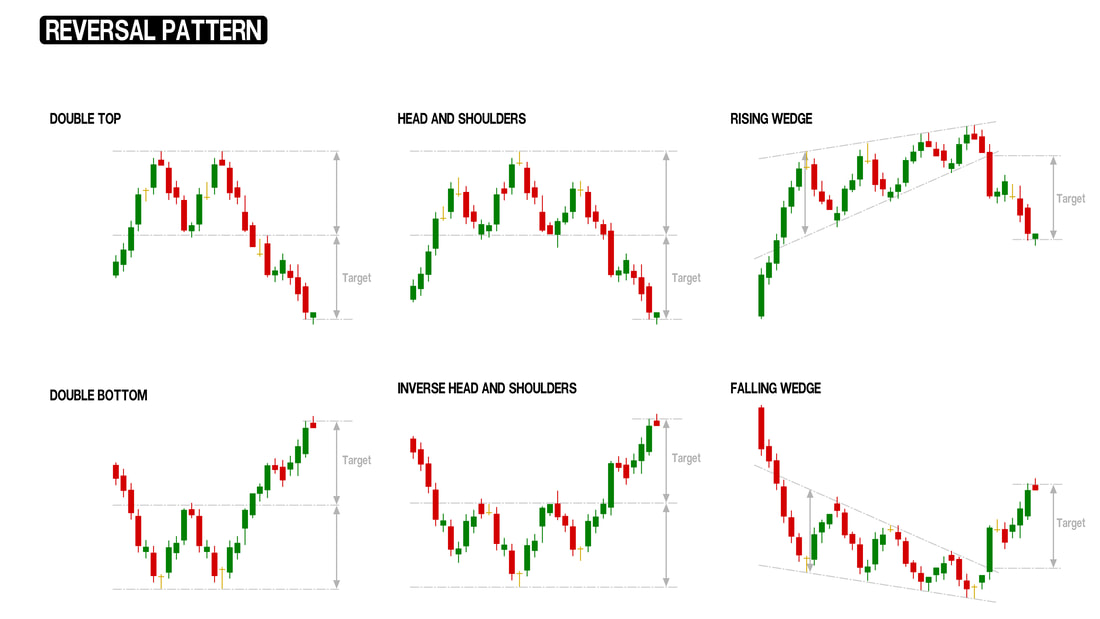 There are definitely more types of patterns out there, whether it's chart patterns, or candlestick patterns like the bullish engulfing candle, but these are just some of the most common ones. Learning to recognize these patterns is an important part of trading if you are trying to get into technical analysis. Not everyone uses chart patterns, some people trade just off volume or sentiment, but, chart patterns are pretty cool too. If you combine these chart patterns with things like volume analysis, that's when things start becoming even better. Read: How to Use Volume Analysis in Stock Trading Below is an example of how combining volume analysis with classic chart patterns can help you profit. Volume on the stock IHRT is generally greater on green days, which is a bullish sign. On top of that, you have a strong up trend that was accompanied by triangle chart patterns.  Watch For The Classic Breakout & RetestSometimes, stocks don't continue right after an initial break out. A stock can break out a bit, but then retrace back to the break out level to retest it, before continuing the trend. This is known as a break out and retest. In fact, the chart shown above is currently retesting the breakout area. As you can see, it had an initial spike when it broke out, but retraced back down to the breakout line. It's more likely than not that it'll hold the breakout line (which is now support) and will continue higher. Below, is another example of a break out and retest that happened with MSFT. Microsoft broke out of a triangle pattern (on increasing green volume) and then pulled back to the trend line, before continuing the break out. We personally like to buy retests because it's harder to get faked out of a retest than on a break out. Break outs can sometimes go up a bit to entice you to buy, fake you out, and then come right back down under the break out zone (at this point, you most likely don't want to be long anymore if the pattern has broken down). Buying a retest can give you more confidence if you see that the stock has started to support nicely at the retest area. You can then put your stop loss under the retest zone for a low-risk trade. 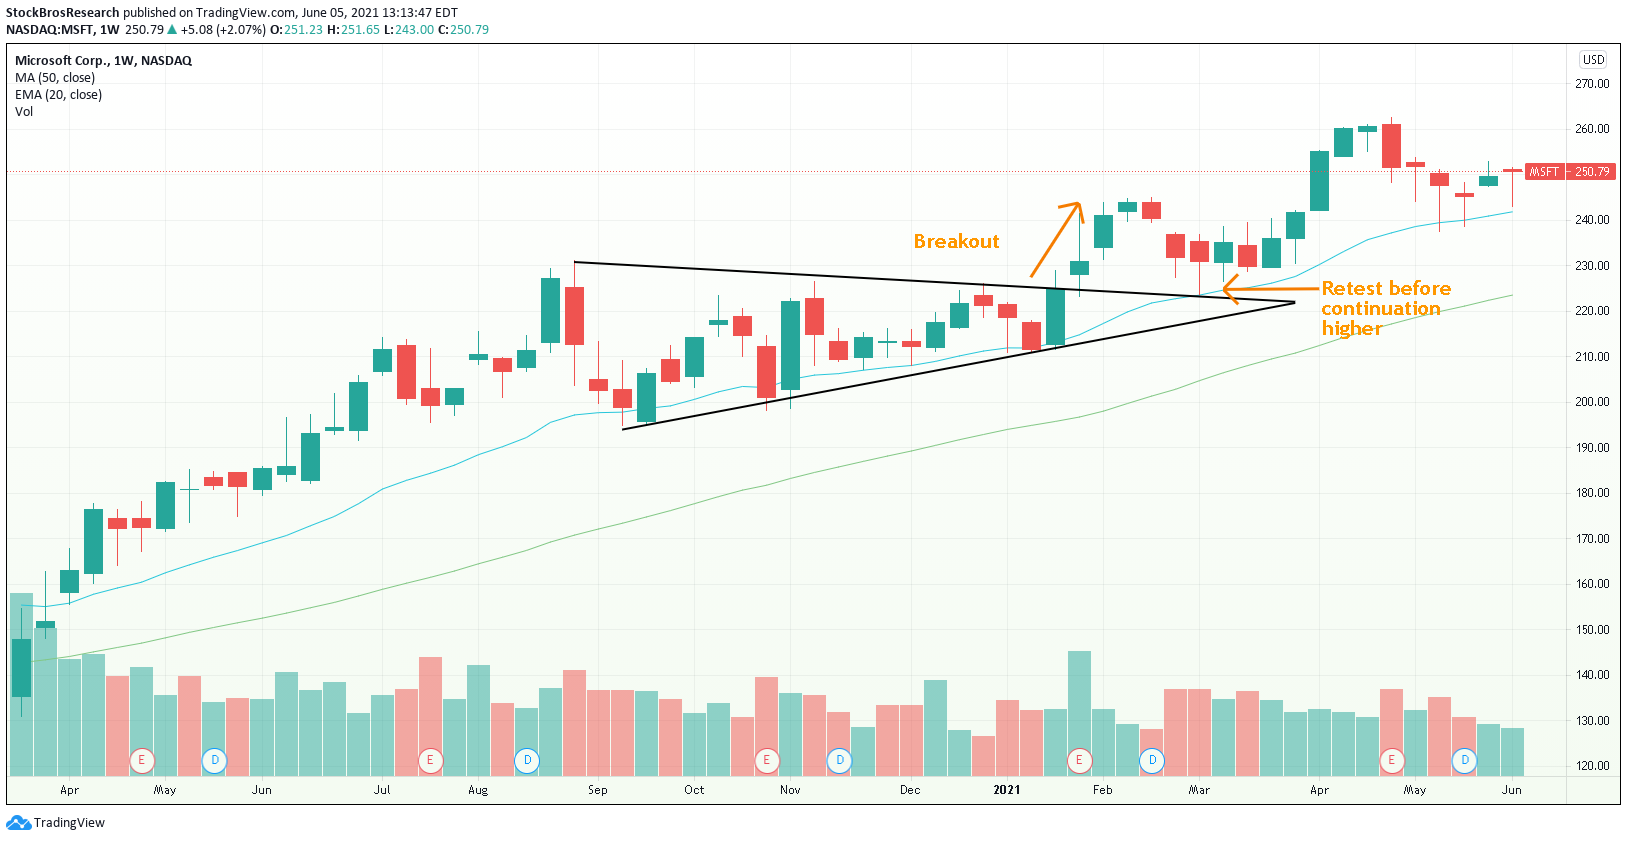 Remember, previous resistance zones often become support levels once a stock breaks out. The opposite is true if a stock breaks down, previous support would become resistance. How to Set Price TargetsIn case you're wondering how to set price targets on any of these setups, there is a simple method of doing it (but it's not the only method). The easiest way to set price targets is to calculate the range between the top and bottom of a technical setup, and then add it to the breakout level. Sound complicated? It's easy, we'll explain it easily below. Take a look at the blue highlighted parts below. Using the same MSFT chart as earlier, you can see that the bottom of the triangle to the top was a $37 move. The break out area was around $225/share. Add $37 to $225 and you get a $262 price target. Not coincidentally, MSFT made it to $262 ish before coming back down. *You can click on the image if it's too small to see*  The TakeawayThere are many chart patterns out there. The ones mentioned in this article are just some of the most common ones. You don't have to know every single one of these chart patterns to be a good trader. If you actually just master 1 or 2 of these patterns, it would probably be better than being mediocre with all of them. These chart patterns don't always work perfectly. Sometimes they'll fake you out multiple times in a row or do things such as breaking out and retesting. The important thing is to find one or a few patterns that work for you and stick to them (test them out for a good amount of time to know if it's worth using for you). If you combine certain things like volume, candlestick patterns, moving averages, or any indicators of choice, your chances of success could be higher. Thanks for reading! We hope this was useful to you. If you enjoyed this article, please consider following us on twitter @StockBrosTrades and/or subscribing to our free newsletter to get articles like this sent to you when they are posted! Related Category Related Articles
|
 Categories
All
Archives
September 2022
|

 RSS Feed