 An often overlooked metric when it comes to stocks is the cash conversion cycle. This metric only applies to companies that carry inventory, such as grocery or apparel, but it is important in measuring a company's efficiency. In this post, we'll explain "What is the Cash Conversion Cycle?" and why it's important, as well as showing some stock performance data for stocks that have a good CCC compared to stocks with a relatively worse CCC. What is the Cash Conversion Cycle?According to investopedia.com: "The cash conversion cycle (CCC) is a metric that expresses the time (measured in days) it takes for a company to convert its investments in inventory and other resources into cash flows from sales. Also called the Net Operating Cycle or simply Cash Cycle, CCC attempts to measure how long each net input dollar is tied up in the production and sales process before it gets converted into cash received. CCC value indicates how efficiently a company’s management is using the short-term assets and liabilities to generate and redeploy the cash and gives a peek into the company’s financial health with respect to cash management." This is why we like to use this metric in our comparisons. Let's try to simplify this. CCC is made up of days inventory outstanding, days sales outstanding, and days payables outstanding. The lower the CCC, the better. Why is lower better? Since it's measured in days, a company would want to take the least amount of days to convert its investments in inventory into cash flow. No one wants to be left holding unsellable inventory for a long time. To better understand why lower is better, we need to take a look at the formula and then understand what each metric means. The formula for the cash conversion cycle is: CCC=DIO+DSO−DPO Days Inventory Outstanding (DIO)Starting with days inventory outstanding, DIO is used to estimate the average number of days a company holds inventory before selling it to customers. The lower, the better, for this metric. This makes sense because a company that can sell its inventory quicker is better than a company that holds inventory for longer, all other things being equal. The formula for DIO is: DIO = (average inventory/cost of goods sold) x (number of days in the measured period) Usually DIO is measured over a 1-year period. Let's take average inventory for example, which is the first part of the formula. If a company had inventory worth $10,000 at the beginning of 2021, and $20,000 inventory at the end of 2021, average inventory would be $15,000. You can find inventory on the balance sheet. Cost of goods sold would just be costs of goods sold figure for the period you are looking at, which can be found on the income statement. Lets pretend COGS is $200,000. And finally, in this case, number of days would be 365. This company's DIO would be 27.4 (calculated as: 15,000/200,000 x 365) Days Sales Outstanding (DSO)According to Finbox, days sales outstanding is a working capital efficiency ratio used to estimate the average number of days a firm takes to collect its receivables. The lower, the better, for this metric. This is because if you were running a company, you would want people to pay you as quickly as possible. Generally, the longer customers take to pay, the worse it is for a company's financial situation. The formula for DSO is: DSO = (Average Accounts Receivable /Sales) x (Number of Days) Days Payables Outstanding (DPO)Days payable outstanding is another efficiency that indicates how many days it takes a company to pay its suppliers. The higher, the better, for this metric. This is because a company would prefer to have the operating leverage to be able to pay its suppliers as late as possible. Having a higher DPO ratio in relation to a DSO ratio is also a good thing. This means that the company is able to collect its cash earned from sales sooner than the company is required to pay its suppliers which is good for net working capital and free cash flow. Although a high DPO is generally a good thing, it may also indicate that the company is having a hard time paying its suppliers. This is where you have to look deeper into the company and use your best judgement to figure out why a company's DPO is very high. The formula for DPO is: DPO = (Average Accounts Payable / Cost of Goods Sold) x Number of Days Putting this altogether, the formula for CCC again is: CCC=DIO+DSO−DPO Negative Cash Conversion CycleCCC can even be less than 0 days, meaning that it takes a company longer to pay its suppliers/bills than it takes for it to sell inventory and collect money. This implies that suppliers are financing that company's operations and as a result, it does not need operating cash to grow. This is of course, a positive thing. Examples of companies with a negative CCC are Apple at -41 days, and Amazon at -36 days, according to Finbox. Do Stocks With a Lower CCC Outperform?The important question: Do these kinds of stocks outperform? Let's find out by comparing stocks with low CCC relative to peers vs stocks with high relative CCC. We're only going to look at the current CCC of stocks and then see their past 5-year stock performance. See the limitations section near the bottom of this post. Comparing CCC of luxury/apparel stocksBelow, you will see 12 apparel/luxury stocks, starting from PVH and ending with GOOS. They are in order of lowest to highest CCC and we've split them up into 2 groups of 6. Group 1, Low CCC apparel/luxury: 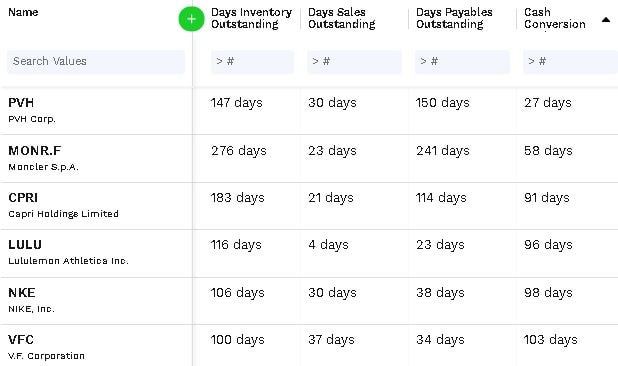 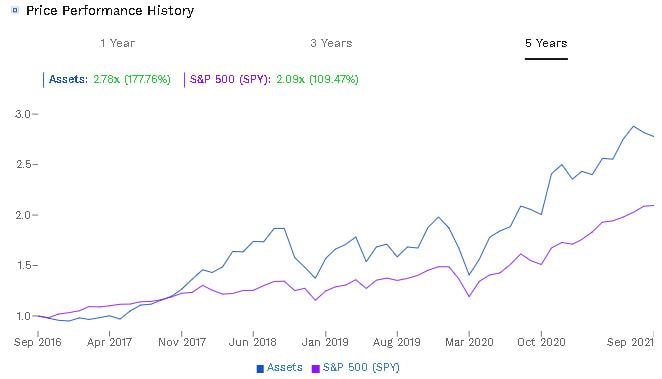 Group 2, High CCC apparel/luxury stocks: 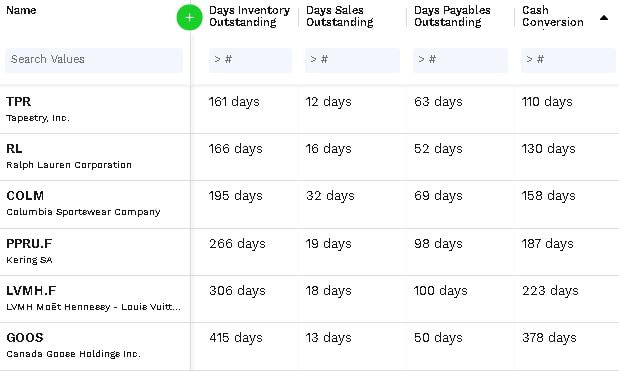 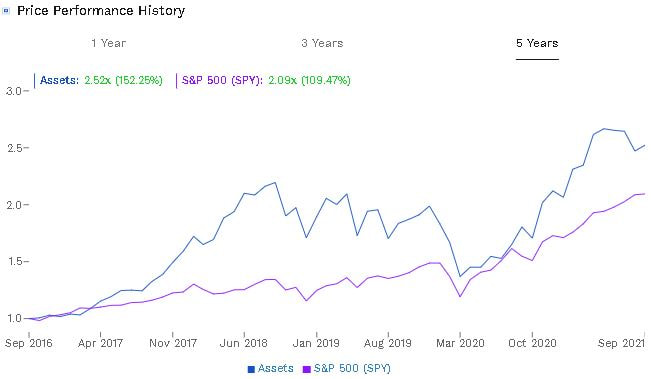 As you can see from the charts above, group 1 (low CCC) outperformed group 2 (higher CCC) in the 5 year period by returning 177.76% vs 152.25%. Comparing CCC of Semiconductor Equipment StocksBelow are 8 semiconductor equipment stocks that compete against each other. They are split up into 2 groups of 4, the first group being low relative CCC and the 2nd group being high CCC. Group 1, Low CCC semi stocks: 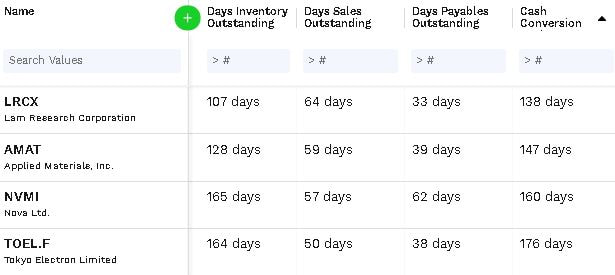 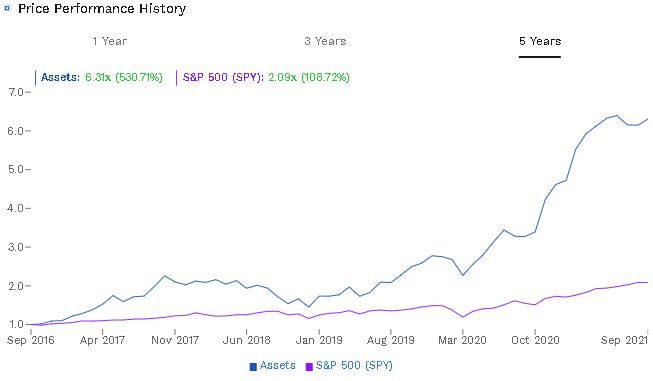 Group 2, high CCC semi stocks: 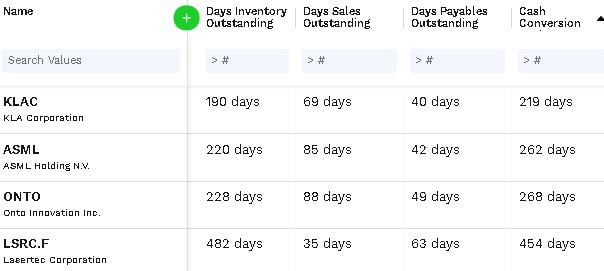 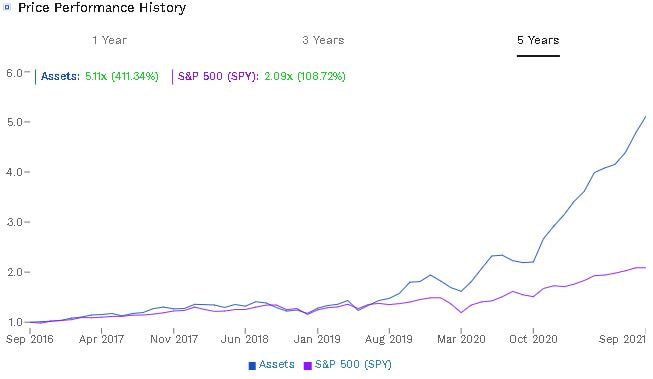 As you can see from the charts above, group 1 of semiconductor stocks (low CCC) outperformed group 2 (higher CCC) in the 5 year period by returning 530.71% vs 411.34%. Comparing CCC of Grocery StocksBelow are 10 grocery stocks. They are split up into two groups of 4 and 6, the first group being low relative CCC and the 2nd group being high CCC. Group 1: Low CCC grocery stocks: 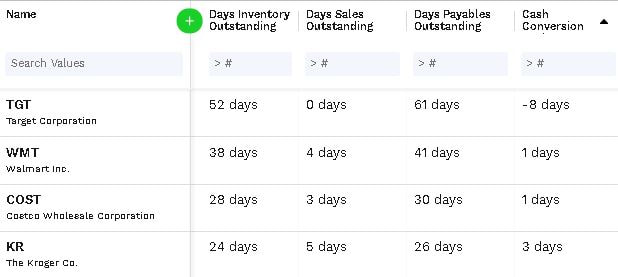 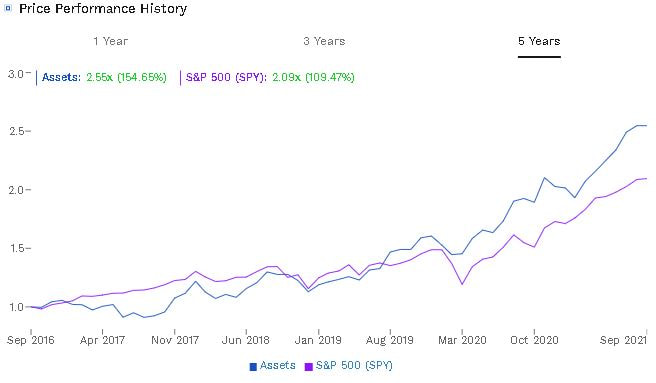 Group 2, High CCC grocery stocks: 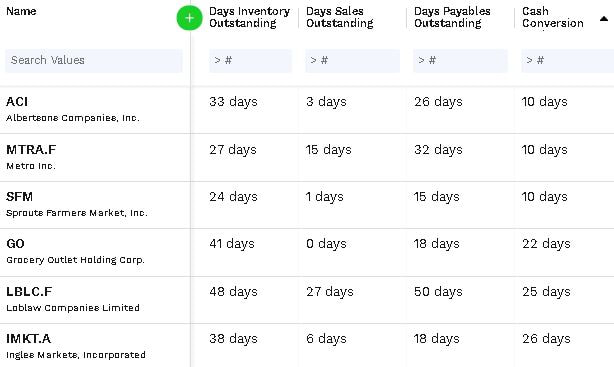 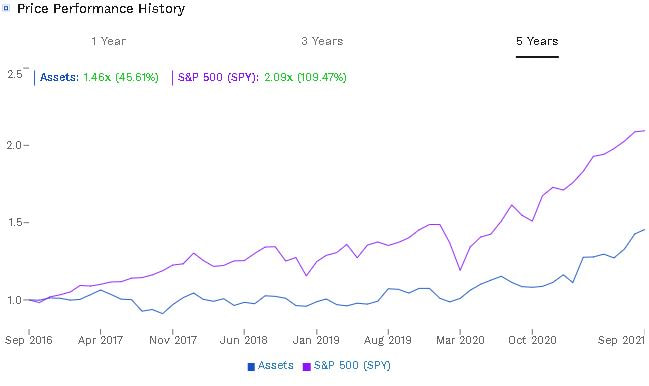 As you can see from the charts above, group 1 of grocery stocks (low CCC) outperformed group 2 (higher CCC) in the 5 year period by returning 154.65% vs 45.61%. Limitations Of Our BacktestsThere are a few major limitations to the quick backtests we just showed. The first limitation is that we are only measuring 5-year performance. It would be more useful if we could test out even longer periods of time. The second limitation is that we are seeing only today's current cash conversion cycle figures, so we don't know for sure if 5 years back, the CCC's for the companies shown were similar to how they are today (unless we do more digging, but these are meant to be quick examples). Third, we only tested a handful of stocks in 3 different sectors. Therefore, these results can vary significantly if tested on a larger group of stocks in different sectors. Also, we can't be sure that the outperformance from low CCC stocks in the examples is purely due to the lower CCC, it could be for other reasons. Like we said earlier, these are just meant to be quick tests, and the results do make sense to us. We compared direct competitors that carry inventory (don't use CCC on companies that don't carry inventory) and saw that the lower CCC had better returns, which makes sense because lower is better. However, don't fully rely on this information (due to the limitations described above), but instead, use it as a starting point to potentially look deeper into how you can incorporate the cash conversion cycle into your analysis. Where to Find Cash Conversion Cycle DataOur favorite website for finding financial data is Finbox. It is what we used to find the CCC numbers and also look at the 5-year performance data. With Finbox, you can easily find high quality stocks with their stock screeners, which include metrics such as CCC and others. Another site that has cash conversion cycle data is koyfin.com, although we do prefer Finbox. Thanks for reading! If you enjoyed this post, please consider following us (Twitter: @StockBrosTrades) or subscribing to our free newsletter to get articles like this sent to you when they are posted! Related Category Related Articles
|
 Categories
All
Archives
September 2022
|

 RSS Feed