|
Are you tired of investing into low-quality stocks? Do you have a criteria when it comes to choosing stocks to invest in? Even if you did have a criteria, do you really know what to look for? After reading this post, hopefully you'll be able to tell a good stock from a not-so-good stock. This criteria is largely (but not fully) inspired by the book 100 Baggers by Christopher Mayer. In Christopher Mayers book "100 Baggers", he talks about how to find potential 100 baggers. The term simply means: stocks that return you 100 times your investment. It is definitely a great book for investors to read. While 100-bagger stocks usually only happen with small caps, you can still find multi baggers with larger stocks. With experience, you can adjust stock picking criteria to your own tastes and still have great results. So, without wasting any more time, let's get right into how we like to pick high quality stocks. What To Look For In StocksHere's our criteria:
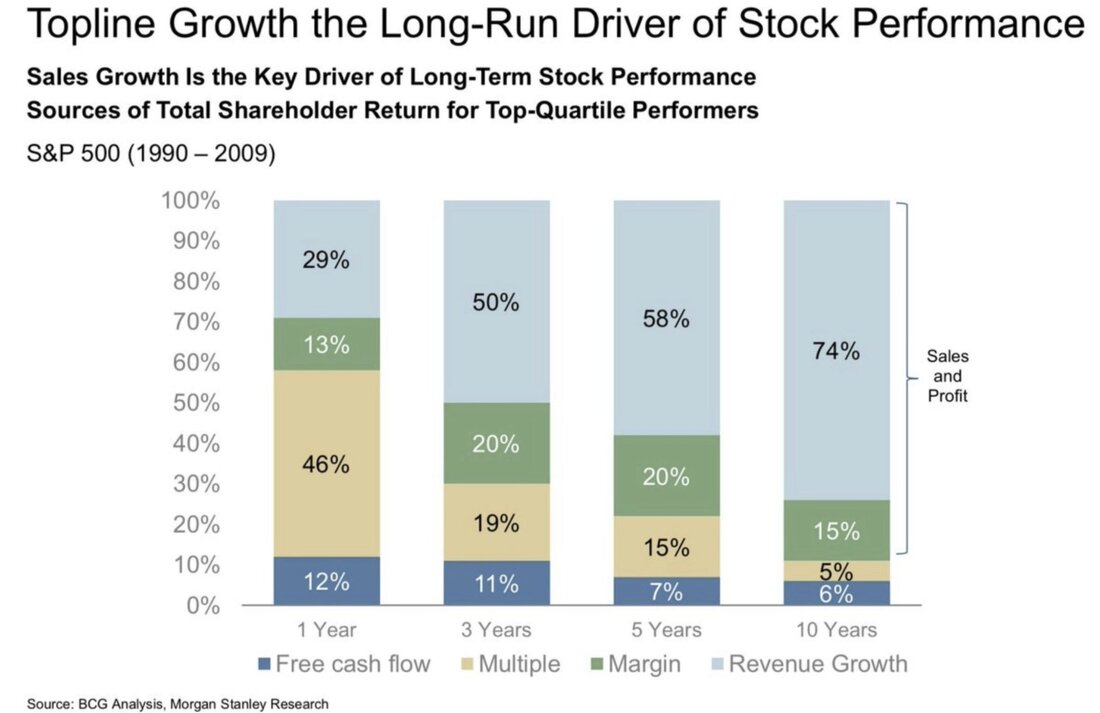
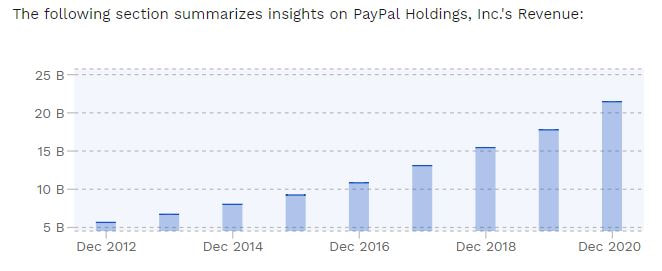
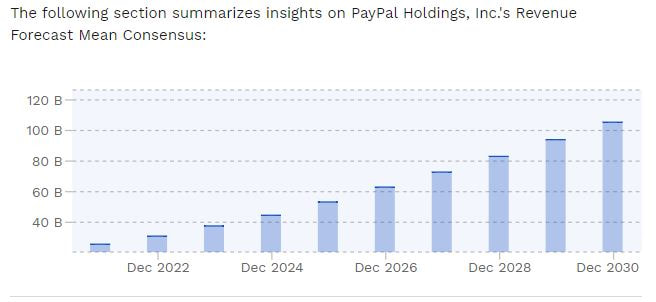
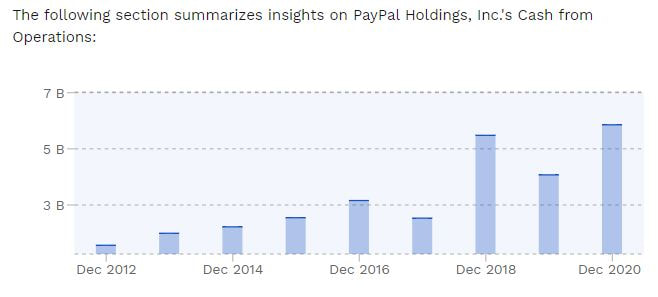
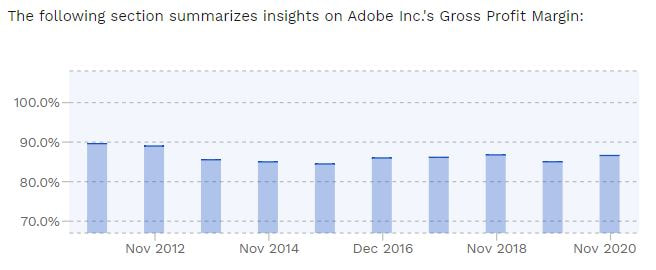
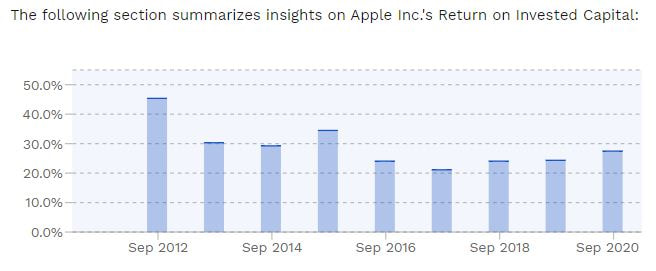
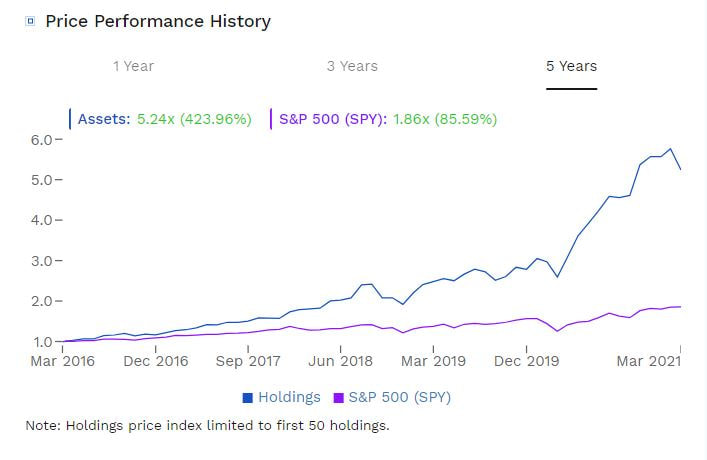
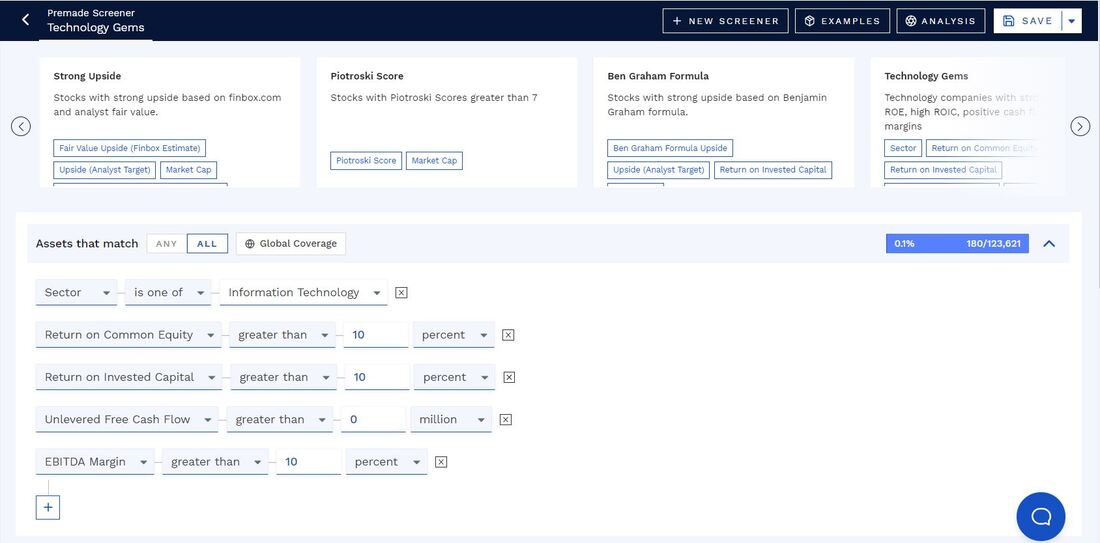
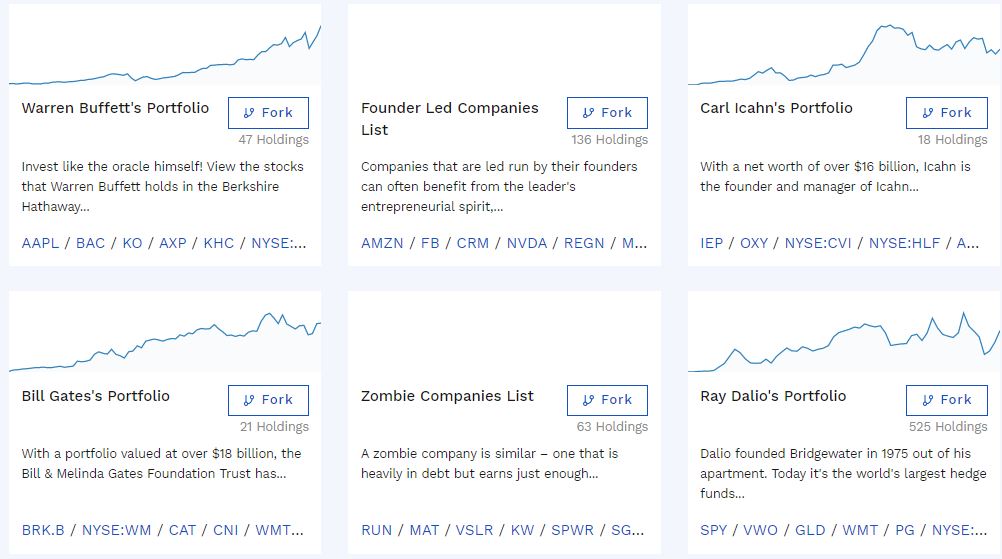
Not EVERY part of the criteria has to be met, but the more the better. Let's explain the criteria in more depth. 1. Steady revenue and earnings growth: Revenue growth is one of the most important parts of the entire criteria. This is because revenue growth is a primary driver in stock price performance over the long term. The image below proves this. Although the study ends at 2009, it's still worth noting. Over a 3-10 year period, revenue growth is by far the biggest key driver of long-term stock performance. This is why you generally want a stock with steady revenue growth, ideally above 10% per year if you want spectacular returns, but this depends on your risk tolerance too. What do we consider to be steady revenue growth? Take a look at Paypal's (PYPL) revenue growth below: Ideally, you want revenue growth to look exactly like that. Sometimes revenue growth can be a bit choppier with some years lower than others, but as long as the choppiness isn't caused by any concerning reasons and the trend is still up, then it should be fine. Past revenue growth is good to have as a track record you can rely on, but the market is forward looking so you need to find out if the company is expected to grow going forward. You can find this out by checking out analyst estimates via sites like simplywall.st, Yahoo Finance, Seeking Alpha, or Finbox to name a few. You can also figure it out by reading into earnings calls/management guidance, or with common sense and having a general understanding of the industry. For example, here's PYPL's revenue projections based on the mean analyst consensus (info via Finbox, other sites may vary). Analyst projections on large companies can be fairly reliable because there are many analysts covering them. For small companies though, take projections with a grain of salt because there is usually little to no coverage on these stocks. If a stock has no coverage, you'd have to use your best judgement or management projections. Steady earnings growth is also important but not as important as one may think. Earnings can sometimes be misleading because of "one-time expenses/gains" and similar things. Sometimes, adjustments need to be made when looking at earnings. However, it is still a bonus to see earnings in a nice uptrend. 2. Cash flow from operations and free cash flow in a long-term uptrend. We prefer cash from operations (also known as operating cash flow) and free cash flow over earnings because it gives a better idea of the actual cash flows a business is taking in. This is because CFO adds back non cash items. Here's the formula: Cash Flow from Operations = Net Income + Non-Cash Items + Changes in Working Capital Then there's free cash flow which shows how much cash flow a company has left over after investing in maintenance and growth expenditures. Free cash flow = Cash From Operations - Capital Expenditures. Using PYPL as an example again, you can see that although its CFO is a bit choppy, it is in an uptrend nonetheless. Some companies may have cash from operations in an uptrend but relatively flat free cash flow levels. This can often be due to high expenditures on growth capex. This is not a cause for concern as the FCF is only being lowered because of heavy amounts of investing in growth. With companies that spend a lot on growth and have improving CFO, if you subtract only maintenance capex instead of both maintenance and growth capex from CFO, you would have an up trending FCF number. CFO minus maintenance capex is also known as "Owner Earnings", which was invented by Warren Buffett. More on maintenance capex in criteria #8. 3. Stable and high gross profit margins relative to industry peers. The higher the gross margins the better. Why? Because gross margins are a measure of profitability, efficiency, and competitiveness. If you take a bunch of businesses offering the same products/services, the one with the highest gross margin is often going to be the best one. The company with high gross margins will most likely have a competitive advantage over its peers that allows it to either charge more for its products/services or pay less to sell them. You also want to see the margins being stable over the years. This usually cements the fact that competition is not eroding the companies profits over time, allowing them to have stable gross profit margins. Stocks in relatively new industries will usually see their margins shrink over time as the industry starts to mature and more competition comes in. This is normal and as long as its margins are high relative to others in the industry and isn't losing market share, it's not a concern. Here is Adobe's (ADBE) gross profit margins over the years. As you can see, they've been stable for for a long time. This is a result of the lack of competition for Adobe. You can read our Adobe article here. 4. Consistently high returns on capital. Here's a famous quote from Warren Buffett that is often referred to when speaking of returns on capital: “Leaving the question of price aside, the best business to own is one that over an extended period can employ large amounts of incremental capital at very high rates of return.” - 1992 Berkshire Hathaway Letter to Shareholders Here's more quotes: “Over the long term, it’s hard for a stock to earn a much better return that the business which underlies it earns. If the business earns six percent on capital over forty years and you hold it for that forty years, you’re not going to make much different than a six percent return – even if you originally buy it at a huge discount. Conversely, if a business earns eighteen percent on capital over twenty or thirty years, even if you pay an expensive looking price, you’ll end up with one hell of a result.” - Charlie Munger “The higher return a business can earn on its capital, the more cash it can produce, the more value is created. Over time, it is hard for investors to earn returns that are much higher than the underlying business’ return on invested capital.” - Warren Buffett These quotes are enough to summarize this entire point, but let's discuss more. Like gross margins, high and stable/growing returns on capital when compared to peers can signify that the company has a competitive advantage and/or is more efficient. There are a few ways to measure return on capital. Popular metrics include Return on Invested Capital (ROIC), Cash Return on Invested Capital (CROIC), Return on Capital Employed (ROCE), Return on Equity (ROE), and Return on Assets (ROA). One of our go to's is ROIC as it is pretty reliable. The formula for ROIC is Net Operating Profit After Tax (known as NOPAT), divided by Average Invested Capital. Invested Capital can be calculated in a few ways but it is generally calculated as average debt + average equity. Thus, if a company has NOPAT of $100, debt of $75, and equity of $150, its ROIC would be 100 / 225 = 44.44%. When we say average invested capital, we mean an average of the past year. ROIC can be directly compared to a company's weighted average cost of capital (WACC), and if a company's ROIC is greater than its WACC, it is considered to be a value creator. If its ROIC is less than its WACC, it is considered to be a value destroyer. Read: The Step by Step Tutorial For Calculating Weighted Average Cost of Capital (WACC) Tip: Moving on to Return on Equity, there are some things you need to consider when looking at this metric. Generally, an increase in debt decreases a company's equity. Since ROE is net income divided by average equity, an increase in debt would give you a higher ROE (assuming net income remains unchanged). Therefore, you need to be careful with ROE if you decide to use it. Monitor if the company has high or increasing ROE's due to decreasing equity rather than improving earnings. Return on equity is definitely useful when analyzing financial institutions like banks and insurance companies though due to the nature of their operations, whereas cash flow metrics (such as CROIC) should NOT be used for these kinds of companies. All these ROC metrics are good to use in general but they really depend on the company that you're looking at. Explaining each metric in detail goes beyond the scope of this article though, therefore it is important to familiarize yourself with each of the metrics so you know when to use which one over the other. As we explained above, ROIC is fairly reliable so it is our go to. When analyzing a company, we'll sometimes look at multiple ROC metrics (if it makes sense for that company) and see how they all stack up next to each other. Here's an example of a good ROIC chart, the stock below is Apple (AAPL). It's ROIC has consistently been above 20%, so it is compounding its returns at a good pace. AAPL's stock returns probably wouldn't have been nearly as good if its ROIC was under 10%. 5. If the company has a moat, this is a big bonus. The term "moat" was coined by Warren Buffett. Investopedia describes an economic moat as "a company's competitive advantage derived as a result of various business tactics that allow it to earn above-average profits for a sustainable period of time." Moats come in several forms and we'll quickly discuss a few of them. For example, Canadian National Railway and Canadian Pacific Railway have moats because they operate a duopoly in the Canadian rail space. They essentially operate with little competition as of right now. Another example of a moat is high switching costs or a product that is inconvenient to switch. Take banks for example, it is quite annoying to switch over bank accounts because everything is already in place at your current bank (weekly paychecks, bill payments, etc.), so even if people want to switch to another bank, they don't do it that often. Strong brand loyalty is a moat as well (think Apple or Nike). Apple can raise prices on its phones with only marginal improvements, and many will still buy, as they have been doing. Moats are a big bonus because of the competitive advantages they offer. This Investopedia article summarizes the topic very well if you're interested in reading it here. 6. Founder led, high insider ownership We wrote an article about founder-led companies, so here are some quotes from our article: "What is a founder-led company? Simply, it is a company that is being led by its founder. The founder should either be the CEO or another important role with a large enough stake in the company to have a say in its operations. Think companies like Tesla with Elon Musk, Amazon.com with Jeff Bezos and Facebook with Mark Zuckerberg." "Founders have an owner's mindset, a front-line obsession, and often have a special/unique feature or capability that can give a business a sense of purpose which trickles down to employees." These kinds of companies have been proven to beat the market over the years. Here's just one example of this in the image below, with the purple line being the S&P 500 returning 85.59% over 5 years starting March 2016, and a portfolio of founder-led companies (blue line) returning about 424% over the same period. This data was taken from Finbox. "If the company isn't founder led, but has a CEO or management team that is heavily invested in the stock, then that is probably good too. When the management team owns a lot of shares, that generally means they truly believe in the stock, and will act in the best interest of long-term shareholders." There's more proof and detail about this concept in our full article, so if you are interested, you can read it here: How to Beat The Market With Founder-Led Stocks - Investing Strategy 7. The stock is trading at a reasonable valuation or is undervalued. How do you know if a stock is good value or not? This can get tricky, as there are many ways of valuing a stock. Drastically overpaying for a stock can potentially hurt you if investors are pricing in perfect performance from the company and all of a sudden, the company fails to deliver. Paying a reasonable price for a great stock is all you need to do to make money in investing. Here's the famous Warren Buffett quote: “It's far better to buy a wonderful company at a fair price than a fair company at a wonderful price.” Taking this advice, you should always look to buy the best companies, as long as they're not way overpriced. If you can find a wonderful company at a wonderful price though, that is a recipe for substantial gains, assuming your analysis is correct. One of the most popular ways of determining a stock's intrinsic value is by performing a discounted cash flow valuation (DCF, for short). Discounted cash flow analysis forecasts future cash flows of a stock/asset and then discounts them back into the present to determine what the future money is worth today (present value). If the present value of the future free cash flows are greater than the current cost of the investment, then it is considered to be good value. You can read our introductory DCF article here: How to Value a Company Using Discounted Cash Flow Analysis (DCF) And our advanced DCF article here: The Ultimate Guide to Advanced Discounted Cash Flow Analysis (DCF) However, that's not the only way to value stocks. As we said, there are many different methods. You can use relative valuation, which is where you value companies based off of ratios such as price to earnings, price to sales, price to free cash flow etc. It's called relative valuation because it will tell you a company's value RELATIVE to other companies in its industry. It won't tell you if the industry as a whole is overvalued though, so you have to keep this in mind when using relative valuation. Here's the most basic example of relative valuation that we can give: ABC stock has a P/E ratio of 8, the industry average P/E is 10. Therefore, based off this metric, ABC is undervalued. ABC has annual earnings per share of $5.50. You think that ABC stock should be trading at the same P/E as its peers because you feel that it is equal to its peers from an operational standpoint. Therefore, 5.50 x 10 = $55.50 fair value. There are other ways of doing these valuations, which you can read about in our article here: How to Use Relative Valuation to Value a Stock - Important Valuation Metrics to Know If you want to learn a cool but complex way of doing a relative valuation using linear regression and PEG ratios, check out this article: How to Correctly Value a Stock Using the PEG Ratio - A Better Way 8. Low maintenance capex margins are a bonus. Capital expenditures (capex) is the money that a company spends to buy, maintain, or improve its fixed assets, like property, plant, and equipment. It also can include intangible expenditures like licenses and patents. Maintenance capex is the amount of money a company needs to spend just to maintain current operations. Look for companies with low maintenance capex relative to their peers. If a company can maintain itself with low amounts of capital, it can spend more money on growth or other objectives. A quick and dirty way to calculate maintenance capex is to deduct depreciation and amortization from total capex. This method is quick but not as good as finding it yourself, which usually might take some extra work like looking into filings or earnings transcripts. However, some companies don't explicitly say what their maintenance capex is, which is when to use the D&A shortcut. Maintenance capex margins = maintenance capex divided by revenue 9. The company should have an acceptable balance sheet When analyzing a stock, it's important its balance sheet to see its current financial health. A balance sheet shows a snapshot of a company's assets and liabilities at the particular date shown on the balance sheet. It is also referred to as the statement of financial position. A company with a lot of cash on hand and little debt is more likely to survive than a company with the opposite. Familiarize yourself with solvency ratios such as the quick ratio, current ratio, and interest coverage ratio. You can ask yourself a few questions: If the company has debt, is it growing at an unhealthy pace year over year? Is the company's debt growing for strategic reasons such as growth combined with tax write-offs, or is it losing control of its debt levels? Is the company's interest payments well covered by its EBIT (earnings before interest and taxes)? Read our article here: How to analyze a balance sheet 10. You should be able to understand what you are investing, for the most part. For obvious reasons, understanding what you're investing in is better than not understanding at all. We don't think it is necessary to FULLY understand every single thing about what you're invested in as long as you mostly understand it and the other criteria in the checklist are met. The main things you need to understand are how the company makes money, how the company is positioned against its competition, the market size, and whether its market is projected to grow or not. How to Find These Top StocksThere are many stock screeners available from well-known websites such as Yahoo Finance, Finviz, and Tradingview. However, the best screener we have come across for fundamental analysis is the one offered by Finbox. Finbox offers many more metrics than other screeners and the screener itself is easy to set up. You can set up your own screener based on your preferred criteria or you can use any of their premade screeners such as this one below: As you can see, there are several screeners to choose from (you'd have to scroll to see the rest), and even the premade ones are customizable in case you want to tweak them. You can add many of the things mentioned in our criteria above such as historical revenue and earnings growth, balance sheet metrics, valuation metrics, and more. This is a key tool to help filter out stocks efficiently. Finbox also has an "ideas" section where there are hundreds of portfolio ideas you can take an in-depth look at. Here's an example of just 6 of them, with Founder-Led Companies being the second one. You can see the holdings in whichever portfolio you choose and sort them by your preferred metrics. More info about this in our article: How to Beat The Market With Founder-Led Stocks ConclusionInvesting is not a one-size-fits-all strategy. There are many investing philosophies that work, and we think this set of criteria works well. However, investing in stocks can be a very risky business. You still have to do your homework when choosing individual stocks and this article only scratches the surface on the amount of things you can look for in stocks. You should only get involved if you have the stomach to handle volatility and you should never use capital that you aren't willing to fully lose. If you've made it this far, thanks for reading! We hope this article has helped you learn about finding quality stocks to invest in. If you enjoyed this post, please consider following us (Twitter: @StockBrosTrades) or subscribing to our free newsletter to get articles like this sent to you when they are posted! Also, as we mentioned several times, we love to use Finbox for our fundamental analysis and we highly recommend it (we are affiliated with them, but we use their platform religiously). Finbox gives you access to accurate, up-to-date information on any stock in the world with over 900 million data points and 1000+ metrics to choose from. It also provides advanced stock screeners, investment ideas, and more. Learn more about Finbox here Related CategoryRelated ArticlesThe Stonk Shop |
Categories
All
Archives
September 2022
|


 RSS Feed